I will show you how to improve your Golang application performance by building Redis from scratch. I use Redis as the case study since it’s well-known, fairly easy to implement, and quite challenging to make it perform better. I did a live streaming to demonstrate all of this a while back, but it was in Bahasa. This blog post aims to make the content easier to consume and reach a wider audience by presenting it in a written format and in English. All the code presented here is available, and feel free to ask questions by opening an issue: goredis.
Note that this article is just an introduction, and I have made some simplifications to make it more consumable. There are some important aspects that I have ignored, such as graceful shutdown, handling lost connections, and more realistic benchmarks. Running it on different machines will also affect the results. I wrote this article with more emphasis on the experience of improving Golang’s performance rather than mimicking what typically happens in a real production environment. However, I hope you can still benefit from the techniques presented in this article.
Redis
Redis is an in-memory key-value database. A key-value database is very simple.
At its core, there are two kinds of queries: SET and GET. You can SET a
key to a certain value, and you can GET a key to return its value. Of course,
in practice, we need more capabilities than just SET and GET, such as
delete, timeout, scan, etc. But for simplicity, I’m going to focus on GET and
SET. Redis is a very popular key-value database, and its protocol is very
simple.
Redis has a reputation for being very fast because it stores all of its data in main memory. While accessing main memory is indeed fast, it’s also quite expensive, which is why we often use Redis as a cache, storing only the hot data for fast access while using other databases like MySQL or PostgreSQL to store the actual data. Apart from that, Redis also has other use cases, such as queuing systems and cardinality counting.
To interact with Redis, we can use
commands. Redis provides a bunch of
commands, but we will only focus on
GET and
SET. We will implement these two
commands and improve their performance. If you look at the SET command
documentation, there are actually
quite a lot of options available. But for simplicity, we won’t implement all of
those options and will only focus on using SET to insert a key-value pair.
To get Redis, you can clone the Redis repository and build it from source using
make:
1git clone https://github.com/redis/redis.git --depth=1 --branch 7.4.2
2cd redis
3make -j 24
Once successful, you will get a bunch of executables. We will focus on
redis-server and redis-benchmark. These binaries are located in the ./src
folder after you successfully build Redis. You can use redis-server to run the
Redis server and redis-benchmark to benchmark your Redis server.
You can start the Redis server by just running the redis-server executable. To
interact with the Redis server, you can use redis-cli, which is also compiled
when you run make.
1# you can specify the port using --port flag
2❯ ./src/redis-server --port 6380
3...
41038846:M 23 Jan 2025 21:35:57.171 * Server initialized
51038846:M 23 Jan 2025 21:35:57.172 * Ready to accept connections tcp
Then you can use redis-cli to interact with the Redis server:
1❯ ./src/redis-cli -p 6380 SET the_key_1 "hello world"
2OK
3❯ ./src/redis-cli -p 6380 GET the_key_1
4"hello world"
Now, this is just one way to interact with Redis. There are a bunch of other ways as well. You can interact with Redis from Go using a library like go-redis. There are also graphical user interfaces to interact with Redis. It’s just like other databases such as MySQL and PostgreSQL; you can use the CLI, call it from Go, or open it using tools like DBeaver.
Redis Protocol
All the libraries and tools that can interact with Redis follow the same
protocol specified by Redis called
RESP.
Fortunately, they have done a good job writing the details of
RESP in their
documentation. It’s actually a very simple protocol, but we won’t go through all
of its specifications. We will only implement the protocol enough so that we can
serve SET and GET commands.
RESP is quite simple. A Redis client connects to Redis server through TCP. Once
connected, the client can send a command to the server and the server will reply
with the response of that command. For commands like GET, the response might
be the value you are trying to get from Redis. For commands like SET, the
response is just a string "OK" if it succeeds. The command and response itself
can be depicted as ordinary data structures like strings, integers, and arrays.
When you run GET the_key, basically your request is just an array of strings,
where the first element is "GET" and the second element is "the_key". The
same goes for the response, it’s just an ordinary data structure. In the case of
GET, the response might either be a string containing the value fetched by the
user, or NULL if the key doesn’t exist.
In the RESP documentation, it is explained how to represent each data type. There are a bunch of data types supported by Redis, but we will only care about 3 types: bulk strings, arrays, and nulls.
- Bulk string will be represented like this:
$<length>\r\n<data>\r\n - Simple string will be represented like this:
+<the_string>\r\n - Arrays will be represented like this:
*<number-of-elements>\r\n<element-1>...<element-n>. - Nulls will be represented by
_\r\n.
The graph below will demonstrate what happens in the network when you interact
with Redis server through the redis-cli.

One interesting property of RESP is that its encoding was designed to be human readable. So, if you want to print their communication protocol, you can actually read it as plain text without additional tools.
Implementing Basic TCP Server
Let’s start simple by implementing a basic echo-tcp-server in Go. The implementation is available in this commit. An echo server is just a server that receives a message from a client and sends back the exact same message to the client.
I like to represent the whole redis server as a struct called server. This
struct will contain all the states we need to be a redis server, including the
list of connected clients and the key-value data itself. I like to separate this
from the main package because I want to be able to use this struct as a library.
It is quite useful to do that because we can test it without actually running
the program.
 1type server struct {
 2    listener net.Listener
 3    logger   *slog.Logger
 4    started  atomic.Bool
 5}
 6
 7func NewServer(listener net.Listener, logger *slog.Logger) *server {
 8    return &server{
 9        listener: listener,
10        logger:   logger,
11        started:  atomic.Bool{},
12    }
13}
The server will have Start and Stop methods to start and stop the server.
Starting the server is pretty straightforward; we just need to start accepting
TCP connections from the clients by calling Accept. Calling Accept blocks
the current goroutine until there is a client requesting to connect. Once
connected, we will handle the client in a separate goroutine. You almost always
want to handle one client from one separate goroutine because most of the
operations you do will block your goroutine. Reading the client request or
sending response blocks the current goroutine. Your goroutine can’t do anything
else while blocked. That’s why you need one goroutine that accepts new clients,
and separate goroutines to handle those clients. The method handleConn will
handle a single connected TCP client. Because we want to run it on a separate
goroutine, we write go s.handleCon(conn).
 1func (s *server) Start() error {
 2    if !s.started.CompareAndSwap(false, true) {
 3        return fmt.Errorf("server already started")
 4    }
 5    s.logger.Info("server started")
 6
 7    for {
 8        conn, err := s.listener.Accept()
 9        if err != nil {
10            // TODO: handle shutdown.
11            // at this point, the server might be shutting down.
12            // or there is a network problem that is causing the
13            // server to be unable to accept new connections.
14            // If it's the former, we just need to do some cleanup.
15            // If it's the latter, we just need to return the error,
16            // nothing we can do anyway.
17            break
18        }
19        go s.handleConn(conn)
20    }
21    return nil
22}
To handle a single client, we just need to reserve a buffer to hold the message
from the client and send that exact same buffer back to the client. If the
client closes the connection, calling Read will return 0, and we can use
this to detect if the client is disconnected.
Note that this is a very simplified version. There could be a case where the client is lost due to network failure or misconfiguration. In this case, the client can’t tell the server that they’re disconnected. From the server’s point of view, the client just stalls there and doesn’t send anything. To avoid this problem, you need to go further and implement some kind of timeout to close the connection if the client doesn’t send anything for a long time.
 1func (s *server) handleConn(conn net.Conn) {
 2    for {
 3        buff := make([]byte, 4096)
 4        n, err := conn.Read(buff)
 5        if err != nil {
 6            // TODO: handle the error
 7            break
 8        }
 9        if n == 0 {
10            // TODO: this means the client is closing the connection
11            break
12        }
13        if _, err := conn.Write(buff[:n]); err != nil {
14            // TODO: handle the error
15            break
16        }
17    }
18}
Stopping the server is quite straightforward; we just need to call Close on
the TCP listener to stop listening. Although, this is not the most ideal way
because there might be some ongoing connections that are currently processing
the user request. When you stop the server like this, those connections might be
disconnected and the client will receive an error. This is not OK in a
production environment because this means whenever you restart this redis
server, there might be a lot of requests failing.
 1func (s *server) Stop() error {
 2    if err := s.listener.Close(); err != nil {
 3        s.logger.Error(
 4            "cannot stop listener",
 5            slog.String("err", err.Error()),
 6        )
 7    }
 8
 9    // Notice that we haven't closed all remaining active connections here.
10    // In Linux and in this particular case, it's technically not necessary
11    // because closing the listener will also close all remaining connections.
12    // But, in some cases, we might need some kind of graceful shutdown logic
13    // when closing the client.
14
15    return nil
16}
Now, let’s think about a better shutdown mechanism. To shutdown a server, we can just stop everything and exit. The operating system will handle all the cleaning up of resources we have like open sockets, files, allocated memory, etc. The thing is, this might not be the ideal way to shutdown, especially when you are running a service like Redis. The TCP connection in your process might be in the middle of a request. Maybe your client sent you a command and you exit the program before the response is sent to the client. When this happens, your client won’t receive the response and will consider it as an error. It would be better to have a mechanism to wait until all in-flight requests are finished while at the same time stopping new requests. Think of it like a “last order” in a restaurant. When a restaurant is closing, they usually make a last order, where people can no longer order food, but the people that have already ordered will still be able to wait for the food and eat there. This is called graceful shutdown, and it’s a common thing to implement when building a service like Redis.
You might wonder: wait, if I shutdown my server, those clients won’t be able to connect to my server anyway. What’s the point of doing all of those works if in the end, those clients will get an error because the server itself is gone? Well, usually, when you shutdown a server, it is because you want to migrate it to a new version or to a new machine with more capacity. To do this, you can run two servers concurrently and shutdown the old one after that. Because of this, we still need to shutdown gracefully so that the client can move to the new server with zero downtime.
Some other kinds of services such as relational databases might have their own shutdown mechanisms. For example, databases like MySQL typically have a log that records all the operations that happened on the database like when a row is added, deleted, and updated. When the database is restarted, it will replay all the operations recorded in the log to get to the same state as before. Doing this is time-consuming when the log is very large. To reduce the amount of replay needed, they usually perform a snapshot of their data periodically. By doing this, they only need to replay the operations that have been done after the last snapshot. If you are building a service like this, you may want to run the snapshot mechanism when you shutdown the service. By doing that, when you start your service again, it will start instantly because there are no operations that need to be replayed.
I won’t implement those graceful shutdown mechanisms here for simplicity reasons. Just be aware that in real systems, this is something that you should think carefully about.
The next step is to write the main function and run our server. The main
function is pretty simple; we just need to prepare the logger and listener for
our server. I will use Golang’s slog package for the logger and I will listen
to port 3100 for the Redis server. There is no particular reason why I use 3100;
it’s just a number that I chose. Once the server is created, I will run it on a
separate goroutine while the main goroutine will be waiting for a signal to
terminate the server. Once the user sends a termination signal, we will call
server.Stop to stop the server.
 1func main() {
 2    logger := slog.New(slog.NewTextHandler(os.Stderr, &slog.HandlerOptions{Level: slog.LevelDebug}))
 3    address := "0.0.0.0:3100"
 4    logger.Info("starting server", slog.String("address", address))
 5    listener, err := net.Listen("tcp", address)
 6    if err != nil {
 7        logger.Error(
 8            "cannot start tcp server",
 9            slog.String("address", address),
10            slog.String("err", err.Error()),
11        )
12        os.Exit(-1)
13    }
14    server := goredis.NewServer(listener, logger)
15
16    go func() {
17        if err := server.Start(); err != nil {
18            logger.Error("server error", slog.String("err", err.Error()))
19            os.Exit(1)
20        }
21    }()
22
23    c := make(chan os.Signal, 1)
24    signal.Notify(c, os.Interrupt)
25    <-c
26
27    if err := server.Stop(); err != nil {
28        logger.Error("cannot stop server", slog.String("err", err.Error()))
29        os.Exit(1)
30    }
31}
Up to this point, we already have a TCP echo server. We can test it by running our program and connecting to it. You can check the full source code on this commit.
1❯ go run ./goredis/main.go
2time=2025-02-03T03:31:03.218+07:00 level=INFO msg="starting server" address=0.0.0.0:3100
3time=2025-02-03T03:31:03.218+07:00 level=INFO msg="server started"
Once you’ve started the server, you can connect to it. To connect to our server,
we can use nc. You can run nc localhost 3100 in your terminal and start
typing what you want to send to the server there. After you press enter, the
message you typed will be sent to the server and the server will send back the
exact same message. You can type Ctrl+C once you’re done. Pressing Ctrl+C
will send an interrupt to nc and nc will treat it as a termination signal
and exit the process.
1❯ nc localhost 3100
2Hi, there
3Hi, there
4How are you?
5How are you?
Implement RESP
Now we have a working TCP server, let’s start serving Redis requests. As
described by RESP documentation, a Redis command is just an array of strings
encoded using the RESP specification. Let’s write
a function
that takes bytes and parses those bytes into a Go data structure. So, an encoded
string becomes Go’s string and an encoded array becomes Go’s slice.
Before that, I want to point out that instead of taking bytes and returning a Go
data type, we may want to take an io.Reader instead. By taking io.Reader, we
can work with more types instead of just bytes. If you look at the io.Reader
interface, it’s basically just an interface to read a bunch of bytes. If you
want to pass bytes directly, you can still use bytes.Buffer. In our case, when
we accept a client connection, we will get a
net.Conn that also implements io.Reader.
Accepting io.Reader will make it easier for us to work with multiple data
sources. This can be handy for testing. In our real service, the io.Reader is
backed by net.Conn. But, if we want to test our implementation, we can just
pass bytes.Buffer to it and it will work. We don’t have to make a real TCP
connection just to test our RESP parser.
Ok, first, let’s implement a helper function to read a single byte from an
io.Reader.
 1func readOne(r io.Reader) (byte, error) {
 2    buff := [1]byte{}
 3    n, err := r.Read(buff[:])
 4    if err != nil {
 5        return 0, err
 6    }
 7    // n represents the number of bytes read when we call `r.Read`.
 8    // since `buff`'s length is one, we should read one byte. Otherwise,
 9    // the client must've been disconnected.
10    if n != 1 {
11        return 0, io.EOF
12    }
13    return buff[0], nil
14}
Parsing the RESP data type is quite simple. The first byte of the stream
basically gives us information about what data type we should read next. If it’s
a *, then you should parse an array. If it’s a $, then you should parse a
string. There are other data types such as integers, booleans, maps, etc., but
we won’t be focusing on those.
 1func readObject(r io.Reader) (any, error) {
 2    b, err := readOne(r)
 3    if err != nil {
 4        return nil, err
 5    }
 6    switch b {
 7    case '*':
 8        return readArray(r, false)
 9    case '$':
10        return readBulkString(r)
11    default:
12        return nil, fmt.Errorf("unrecognized character %c", b)
13    }
14}
Next, we just need to parse it as described by the standard. If it’s a string, we just need to parse its length and read that many bytes.
 1func readBulkString(r io.Reader) (string, error) {
 2    size, err := readLength(r)
 3    if err != nil {
 4        return "", err
 5    }
 6    buff := make([]byte, size)
 7    if _, err := io.ReadFull(r, buff); err != nil {
 8        return "", err
 9    }
10    b, err := readOne(r)
11    if err != nil {
12        return "", err
13    }
14    if b != '\r' {
15        return "", fmt.Errorf("expected carriage-return character for array, but found %c", b)
16    }
17    b, err = readOne(r)
18    if err != nil {
19        return "", err
20    }
21    if b != '\n' {
22        return "", fmt.Errorf("expected newline character for array, but found %c", b)
23    }
24    return string(buff), nil
25}
26
27func readLength(r io.Reader) (int, error) {
28    result := 0
29    for {
30        b, err := readOne(r)
31        if err != nil {
32            return 0, err
33        }
34        if b == '\r' {
35            break
36        }
37        result = result*10 + int(b-'0')
38    }
39    b, err := readOne(r)
40    if err != nil {
41        return 0, err
42    }
43    if b != '\n' {
44        return 0, fmt.Errorf("expected newline character for length, but found %c", b)
45    }
46    return result, nil
47}
If it’s an array, we just need to read its length and recursively parse the array items as many times as the length of the array.
 1func readArray(r io.Reader, readFirstChar bool) ([]any, error) {
 2    if readFirstChar {
 3        b, err := readOne(r)
 4        if err != nil {
 5            return nil, err
 6        }
 7        if b != '*' {
 8            return nil, fmt.Errorf("expected * character for array, but found %c", b)
 9        }
10    }
11    n, err := readLength(r)
12    if err != nil {
13        return nil, err
14    }
15    result := make([]any, n)
16    for i := 0; i < n; i++ {
17        val, err := readObject(r)
18        if err != nil {
19            return nil, err
20        }
21        result[i] = val
22    }
23    return result, nil
24}
We also need a way to encode our response in RESP format. However, encoding the
response is way easier than parsing it. We could just use fmt.Sprintf or
fmt.Fprintf to do that easily. For example, if you want to encode a string,
just write fmt.Sprintf("$%d\r\n%s\r\n", len(theString), theString). Because of
that, we don’t need a helper to do this.
Implement SET and GET
Now that we already know how to parse RESP messages, we can use them to read
user’s commands and handle them. Instead of just echoing whatever the client
sends to our server, now we will parse it and handle it. We can use the
readArray helper function above to read the command from the user, take its
first element as the command name, and handle them based on the command.
Check out this commit for the full code.
 1func (s *server) handleConn(clientId int64, conn net.Conn) {
 2    ...
 3    for {
 4        request, err := readArray(conn, true)
 5        ...
 6        commandName, ok := request[0].(string)
 7        ...
 8        switch strings.ToUpper(commandName) {
 9        case "GET":
10            s.logger.Debug("handle get command", slog.Int64("clientId", clientId))
11        case "SET":
12            s.logger.Debug("handle set command", slog.Int64("clientId", clientId))
13        default:
14            s.logger.Error("unknown command", slog.String("command", commandName), slog.Int64("clientId", clientId))
15        }
16        ...
17        conn.Write([]byte("+OK\r\n"))
18    }
19    ...
20}
As you can see, we just need to read the client message, parse it using
readArray, take the first element and treat it as the command name. In the
code above, we just log the command; next, we will write a function for each
command we want to handle. In this case, we have a function that handles the
SET command and a function that handles the GET command.
 1func (s *server) handleConn(clientId int64, conn net.Conn) {
 2    ...
 3    switch strings.ToUpper(commandName) {
 4    case "GET":
 5        err = s.handleGetCommand(clientId, conn, request)
 6    case "SET":
 7        err = s.handleSetCommand(clientId, conn, request)
 8    }
 9    ...
10}
11
12func (s *server) handleGetCommand(clientId int64, conn net.Conn, command []any) error {
13    if len(command) < 2 {
14        _, err := conn.Write([]byte("-ERR missing key\r\n"))
15        return err
16    }
17    key, ok := command[1].(string)
18    if !ok {
19        _, err := conn.Write([]byte("-ERR key is not a string\r\n"))
20        return err
21    }
22    s.logger.Debug("GET key", slog.String("key", key), slog.Int64("clientId", clientId))
23    // TODO: the GET logic goes here
24    _, err := conn.Write([]byte("_\r\n"))
25    return err
26}
27
28func (s *server) handleSetCommand(clientId int64, conn net.Conn, command []any) error {
29    if len(command) < 3 {
30        _, err := conn.Write([]byte("-ERR missing key and value\r\n"))
31        return err
32    }
33    key, ok := command[1].(string)
34    if !ok {
35        _, err := conn.Write([]byte("-ERR key is not a string\r\n"))
36        return err
37    }
38    value, ok := command[2].(string)
39    if !ok {
40        _, err := conn.Write([]byte("-ERR value is not a string\r\n"))
41        return err
42    }
43    s.logger.Debug(
44        "SET key into value",
45        slog.String("key", key),
46        slog.String("value", value),
47        slog.Int64("clientId", clientId),
48    )
49    // TODO: the SET logic goes here
50    _, err := conn.Write([]byte("+OK\r\n"))
51    return err
52}
There is nothing magical in the above code. We just write functions to handle
each command and write a few lines of code to fetch its parameters. In the case
of the GET command, we want to fetch the key, and in the case of the SET
command, we want to fetch the key and value. We just return OK for the SET
command and (nil) for the GET command. Next, we will implement the actual
logic to handle SET and GET.
You can think of Redis as a map[string]string. SET and GET commands are
basically just commands to interact with that map. Running SET user1 Andy is
basically just saying m["user1"] = "Andy". And running GET user1 is
basically just like m["user1"]. So, let’s just do that: create a map in the
server struct and handle SET by inserting to that map, and handle GET by
fetching a key from that map. The problem is, you need to make sure that there
are no conflicting operations happening concurrently. You can’t have two
goroutines accessing the same map when one of them is a write operation. This is
what we call a race condition.
It’s a condition where you have two threads that concurrently access the same
memory region and their operations are conflicting. When this happens, you might
end up with corrupted data structures. In Go, the runtime might check this
condition and throw a panic if that happens.
Race Condition: to understand this concept, imagine having a stack of integers. You can push to the stack like this:
1type stack struct {
2    data []int
3    top  int
4}
5
6func (s *stack) Push(value int) {
7    s.data[s.top] = value
8    s.top += 1
9}
It looks very simple and perfect, but it’s actually not thread-safe and can have problems if you call
Pushfrom two concurrent goroutines. Imagine you have goroutine A and goroutine B. The stack was empty and both of them are callingPushat the same time. It just happens that both goroutine A and B execute line 7 at the same time. As a result, both of them sets.data[0]. Now, goroutine A might executes.top += 1first and then be followed by goroutine B, or the other way around. As a result, once both goroutines finish, the stack’stopfield is incremented twice, yets.data[1]is never filled ands.data[0]is filled twice. This is an example of a race condition. Because there are two conflicting goroutines touching the same memory region, they might corrupt each other.
To avoid race conditions, we can use sync.Mutex or sync.RWMutex. The way we
avoid race conditions is by grabbing a lock before executing critical sections.
We can write our code such that every time we access the map, a lock has to be
acquired first. After we finish accessing the map, we can release the lock.
Other goroutines that might want to access the map will also need to acquire the
lock first. If a lock is already acquired by another goroutine, acquiring the
lock will block the goroutine until the one that holds the lock releases it. To
acquire a lock, you can call the Lock method on sync.Mutex, and you can use
the Unlock method to release the lock.
Now, if you think about it, when two or more goroutines are reading the same
memory region, it shouldn’t be a problem because they’re just reading it. The
race condition will only happen when those goroutines are conflicting. Reading
is not conflicting with another reading. You will only conflict when one of the
operations is a write operation. Because of that, instead of having a simple
locking mechanism, you want the lock to be smart enough so that if the goroutine
that holds the lock only uses it to read data from your map, another goroutine
can also acquire the lock if it’s just for reading the data. This is where
sync.RWMutex can help you. Now, you have 4 methods: Lock, Unlock, RLock,
RUnlock. Lock and Unlock behave similarly to the sync.Mutex. You can use
RLock to acquire the lock for reading the map. When you hold the lock for
reading, another goroutine that calls RLock won’t be blocked.
 1type server struct {
 2    ...
 3    dbLock   sync.RWMutex
 4    database map[string]string
 5}
 6
 7func (s *server) handleGetCommand(clientId int64, conn net.Conn, command []any) error {
 8    ...
 9    s.dbLock.RLock()
10    value, ok := s.database[key]
11    s.dbLock.RUnlock()
12    ...
13
14    var err error
15    if ok {
16        resp := fmt.Sprintf("$%d\r\n%s\r\n", len(value), value)
17        _, err = conn.Write([]byte(resp))
18    } else {
19        _, err = conn.Write([]byte("_\r\n"))
20    }
21    return err
22}
23
24func (s *server) handleSetCommand(clientId int64, conn net.Conn, command []any) error {
25    ...
26    s.dbLock.Lock()
27    s.database[key] = value
28    s.dbLock.Unlock()
29    ...
30}
You can find the code in this commit.
Testing And Benchmark
Congratulations, we now have a very simple Redis server. We can start our Redis
server by running go run ./goredis/main.go.
1❯ go run ./goredis/main.go
2time=2025-01-31T22:23:54.458+07:00 level=INFO msg="starting server" address=0.0.0.0:3100
3time=2025-01-31T22:23:54.458+07:00 level=INFO msg="server started"
4...
We can now run commands from redis-cli:
1❯ ./redis-cli -h localhost -p 3100 SET key1 value1
2OK
3❯ ./redis-cli -h localhost -p 3100 GET key1
4"value1"
5❯ ./redis-cli -h localhost -p 3100 GET key2
6(nil)
As you can see, our Redis server works nicely.
Ideally, you want to test your implementation very often. Every time you make a change, you need to make sure that you don’t break the Redis server. To be sure, you need to test it every time you make changes. Testing manually like this is tedious, boring, and prone to error. To make things easier and more reliable, you can write an automated test. Then, you can run your automated test every time you make a change and make sure that the tests don’t break. You can check this commit, this commit, and this commit to see how I wrote the automated tests.
Now, let’s try to see the performance of our server. We are going to benchmark
the server using the redis-benchmark tool that we’ve compiled before.
1❯ ./redis-benchmark -h localhost -p 3100 -r 100000000000 -c 50 -t SET,GET -q
2WARNING: Could not fetch server CONFIG
3SET: 104602.52 requests per second, p50=0.263 msec
4GET: 110132.16 requests per second, p50=0.247 msec
5...
In the command above, we run the redis benchmark using 100 billion possible keys
and using 50 concurrent connections. After you run that command, your server
will be hit by 100,000 requests, and the result is reported. If you see the
result above, our server can handle roughly 104K SET operations per second and
110K GET operations per second. It also reports that the latency of SET
requests has a median of 0.2ms and the latency of GET requests has a median of
0.2ms. You might get different results depending on the machine you’re running.
Note that this number might not be very useful in the real world. In the real world, the access pattern is usually not uniform like this. Some keys are accessed more often than other keys, for example. The timing is also rarely this regular. We also rarely use median to measure the latency. Instead, the 95th percentile is more representative. Having a median of 0.26ms means half of your
SETrequests are served below 0.2ms. But half of the requests is a very small number. What people usually want is to have good latency on 95%, 99%, or even 100% of the requests. But again, we are going to stick with this benchmark mechanism for simplicity’s sake. If you want to do a proper benchmark, you should think about your production environment and try to mimic its access pattern as closely as possible.
Looking at the benchmark result, it’s hard to know whether our Redis server has
good performance. In order to evaluate this number, we can compare it to the
actual Redis implementation. First, let’s start the redis-server.
 1❯ ./redis-server --port 3200
 2182161:C 31 Jan 2025 22:50:45.805 * oO0OoO0OoO0Oo Redis is starting oO0OoO0OoO0Oo
 3182161:C 31 Jan 2025 22:50:45.805 * Redis version=7.4.2, bits=64, commit=a0a6f23d, modified=0, pid=182161, just started
 4182161:C 31 Jan 2025 22:50:45.805 * Configuration loaded
 5182161:M 31 Jan 2025 22:50:45.805 * monotonic clock: POSIX clock_gettime
 6                _._
 7           _.-``__ ''-._
 8      _.-``    `.  `_.  ''-._           Redis Community Edition
 9  .-`` .-```.  ```\/    _.,_ ''-._     7.4.2 (a0a6f23d/0) 64 bit
10 (    '      ,       .-`  | `,    )     Running in standalone mode
11 |`-._`-...-` __...-.``-._|'` _.-'|     Port: 3200
12 |    `-._   `._    /     _.-'    |     PID: 182161
13  `-._    `-._  `-./  _.-'    _.-'
14 |`-._`-._    `-.__.-'    _.-'_.-'|
15 |    `-._`-._        _.-'_.-'    |           https://redis.io
16  `-._    `-._`-.__.-'_.-'    _.-'
17 |`-._`-._    `-.__.-'    _.-'_.-'|
18 |    `-._`-._        _.-'_.-'    |
19  `-._    `-._`-.__.-'_.-'    _.-'
20      `-._    `-.__.-'    _.-'
21          `-._        _.-'
22              `-.__.-'
23
24182161:M 31 Jan 2025 22:50:45.806 * Server initialized
25182161:M 31 Jan 2025 22:50:45.806 * Loading RDB produced by version 7.4.2
26182161:M 31 Jan 2025 22:50:45.806 * RDB age 105 seconds
27182161:M 31 Jan 2025 22:50:45.806 * RDB memory usage when created 16.70 Mb
28182161:M 31 Jan 2025 22:50:45.846 * Done loading RDB, keys loaded: 199983, keys expired: 0.
29182161:M 31 Jan 2025 22:50:45.846 * DB loaded from disk: 0.041 seconds
30182161:M 31 Jan 2025 22:50:45.846 * Ready to accept connections tcp
31...
And then, we can re-run the benchmark command above but for port 3200 since we
use that port to run the redis-server.
1❯ ./redis-benchmark -h localhost -p 3200 -r 100000000000 -c 50 -t SET,GET -q
2SET: 136612.02 requests per second, p50=0.183 msec
3GET: 122399.02 requests per second, p50=0.223 msec
As you can see, your performance is similar to the actual Redis. We don’t do any tricks here. What we’ve done is roughly the same as what Redis has done as well.
Redis can actually perform better than that. During benchmarking, there is
actually some overhead in the communication. Each time the client (in this case
the client is redis-benchmark) sends a command to Redis server, the command
needs to be copied from the client’s memory to kernel memory and copied again
from kernel memory to Redis server memory. There are a bunch of copying
operations between user space and kernel space here and it might affect the
performance. In order to reduce this overhead, we can use pipelined benchmark.
Without pipeline, in order to send N requests to the Redis server, the client
will need to send a command to Redis server and then wait for the response for
N times. This means there are roughly 2*N times copy performed from user
space to kernel space. By using pipeline, the client can send those N requests
at once and wait for N responses at once as well. By doing that, the number of
interactions between the user space and kernel will be minimized.

Again, note that most real-world applications don’t do pipelining. What we do here is not really depicting what will happen in a production environment. We do pipelining to make things more interesting and see how high the throughput we can get, and how low the latency we can get.
Let’s run the benchmark again for the actual Redis server with pipeline enabled.
1❯ ./redis-benchmark -h localhost -p 3200 -r 100000000000 -c 50 -t SET,GET -P 10000 -q
2SET: 2130160.75 requests per second, p50=3.079 msec
3GET: 2652540.00 requests per second, p50=14.255 msec
By adding -P 10000, we set the redis-benchmark to pipeline 10,000 requests
into a single message. As you can see, now we have higher throughput. Now we get
about 2.1 million SET operations per second and 2.6 million GET operations
per second. It’s almost 10x higher. But, you might notice that the latency is
increasing. The median of SET’s latency has now increased to 3ms from
previously only 0.23ms. This is the effect of pipelining. When we pipeline
requests together, some requests might end up being served a little bit longer.
Previously, to handle a request, you just needed to send the command to Redis
server and wait for the response. With pipelining, when you want to execute a
command, you don’t send the command directly, but you need to wait for the other
9,999 commands first to be sent together as a batch.
Let’s try benchmarking our Redis server written in Go using pipelining:
1❯ ./redis-benchmark -h localhost -p 3100 -r 100000000000 -c 50 -t SET,GET -P 10000 -q
2WARNING: Could not fetch server CONFIG
3SET: 103413.09 requests per second, p50=6.135 msec
4GET: 109966.45 requests per second, p50=5.279 msec
As you can see, the throughput doesn’t change that much. This makes sense because we don’t really have any special code to handle pipelined requests. As far as we know, the requests are coming one by one and we handle them one by one as well. There is no optimization we’ve done to handle pipelined requests. The latency is also increasing, which also makes sense due to the same reason the latency increased in the actual Redis server benchmark.
Now, instead of using redis-benchmark, we will benchmark our Redis server
implementation using Golang’s benchmarking framework. By writing our own
benchmark, we can have more flexible benchmarking logic. We can, for example,
simulate a load where the access pattern resembles the access pattern in our
actual production environment. We can also run profiler to trace our CPU and
memory usage. This is very useful to find our app’s bottleneck, which will help
us to build applications with better performance. For simplicity’s sake, our
benchmark will just use uniformly distributed keys for SET command, just like
redis-benchmark. We are not going to write benchmark test for GET command.
There is nothing special about the GET command, so it can be left as an
exercise for the reader.
To create a benchmark test, you just need to write a function with Benchmark
prefix, accept a *testing.B as its parameter, and return nothing. This is the
convention used by Golang’s testing framework. I’ll put the benchmark logic in
server_test.go:
1func BenchmarkRedisSet(b *testing.B) {
2    ...
3}
To do the benchmark, first we will initialize the server. Ideally, we want our benchmark code to be efficient so that it won’t affect the code we’re running. To reduce the TCP overhead, we are going to use sockfile instead of opening a socket. By using sockfile, the communication between the client and the server will not be using TCP, but it will be done internally in the kernel.
 1const sockfilePath string = "/tmp/redisexperiment.sock"
 2
 3func BenchmarkRedisSet(b *testing.B) {
 4    _ = os.Remove(sockfilePath)
 5    listener, err := net.Listen("unix", sockfilePath)
 6    if err != nil {
 7        b.Errorf("cannot open sock file: %s", err.Error())
 8        return
 9    }
10    noopLogger := slog.New(slog.NewTextHandler(io.Discard, nil))
11    server := NewServer(listener, noopLogger)
12    go func() {
13        if err := server.Start(); err != nil {
14            b.Errorf("cannot start server: %s", err.Error())
15        }
16    }()
17
18    // you need to reset the timer here to make sure that
19    // the initialization code above won't be considered as
20    // part of the benchmark.
21    b.ResetTimer()
22    ...
23}
Now, we just need to spawn some goroutines that will simulate the client. One
goroutine will simulate a single client connection. Instead of spawning
goroutines manually, we can use b.RunParallel helper function provided by
Golang’s testing framework. We don’t spawn goroutines manually because using
b.RunParallel is quite handy. It provides you a way to distribute the load to
multiple goroutines efficiently. Suppose you want to hit your server with
100,000 requests. Now you need to make sure that the sum of the number of
requests sent by each one of your spawned goroutines should be 100,000.
b.RunParallel can help you with this. b.RunParallel gives you a parameter
*testing.PB that you can use to check if your goroutine should send a request
or not. Calling pb.Next() returns true if you need to send another request
to the server, and it will return false if you’ve sent 100,000 requests to the
server and you can stop now. Additionally, by using b.RunParallel you can
configure the number of goroutines that will be used without changing the code.
You can configure it from the command line when you run the benchmark. You can
also do all of those manually, but for most cases, it’s more convenient to use
b.RunParallel.
 1func BenchmarkRedisSet(b *testing.B) {
 2    ...
 3    id := atomic.Int64{}
 4    b.RunParallel(func(pb *testing.PB) {
 5        // First, you need to create a connection to the server
 6        client, err := net.Dial("unix", sockfilePath)
 7        ...
 8        randomizer := rand.New(rand.NewSource(id.Add(1)))
 9        pipelineSize := 100
10        buff := make([]byte, 4096)
11        writeBuffer := bytes.Buffer{}
12        count := 0
13
14        // pb.Next() returns true if you still need to send a request
15        // to the server. When it returns false, it means you already
16        // reached your target and you can stop sending requests.
17        for pb.Next() {
18            // These lines generate SET command with randomized key and value.
19            // We put the command to a buffer called `writeBuffer`. After the buffer
20            // is big enough, we send it to the server in one go. That's how we
21            // pipeline the requests.
22            writeBuffer.WriteString("*3\r\n$3\r\nset\r\n$12\r\n")
23            for i := 0; i < 12; i++ {
24                writeBuffer.WriteByte(byte(randomizer.Int31()%96 + 32))
25            }
26            writeBuffer.WriteString("\r\n$12\r\n")
27            for i := 0; i < 12; i++ {
28                writeBuffer.WriteByte(byte(randomizer.Int31()%96 + 32))
29            }
30            writeBuffer.WriteString("\r\n")
31
32            // After reaching a certain threshold, we send the generated requests
33            // to the server and wait for the response. We don't do anything
34            // with the response other than read it.
35            count++
36            if count >= pipelineSize {
37                if _, err := writeBuffer.WriteTo(client); err != nil {
38                    b.Errorf("cannot write to server: %s", err.Error())
39                    return
40                }
41                if _, err := io.ReadFull(client, buff[:5*count]); err != nil {
42                    b.Errorf("cannot read from server: %s", err.Error())
43                    return
44                }
45                count = 0
46            }
47        }
48
49        if count > 0 {
50            if _, err := writeBuffer.WriteTo(client); err != nil {
51                b.Errorf("cannot write to server: %s", err.Error())
52                return
53            }
54            if _, err := io.ReadFull(client, buff[:5*count]); err != nil {
55                b.Errorf("cannot read from server: %s", err.Error())
56                return
57            }
58            count = 0
59        }
60        ...
61    })
62    ...
63}
Don’t forget to close the server after the test is finished.
 1func BenchmarkRedisSet(b *testing.B) {
 2    ...
 3    b.StopTimer()
 4    if err := server.Stop(); err != nil {
 5        b.Errorf("cannot stop server: %s", err.Error())
 6        return
 7    }
 8
 9    // We can also add our own metrics to the benchmark report like this:
10    throughput := float64(b.N) / b.Elapsed().Seconds()
11    b.ReportMetric(throughput, "ops/sec")
12}
You can find the full benchmark code here.
To run the benchmark, you can execute this command:
 1# -bench=BenchmarkRedisSet is used to specify which benchmark function you want to run
 2# -benchmem                is used to tell the framework that you want to benchmark the memory usage
 3# -benchtime=10s           is used to specify the duration of the benchmark
 4# -run="^$"                is saying that you don't want to run any unit test
 5❯ go test . -v -bench=BenchmarkRedisSet -benchmem -benchtime=10s -run="^$"
 6goos: linux
 7goarch: amd64
 8pkg: github.com/jauhararifin/goredis
 9cpu: AMD Ryzen 9 7900X 12-Core Processor
10BenchmarkRedisSet
11BenchmarkRedisSet-24             9774513              1289 ns/op            776083 ops/sec           585 B/op         42 allocs/op
12PASS
13ok      github.com/jauhararifin/goredis 14.199s
Once the benchmark finished, you can see the result. As you can see above, the
benchmark runs about 14 seconds, sending about 9.7 million requests. The
throughput of the system is roughly 776K requests per second and each request is
handled at 1,289 nanoseconds on average. Since we add -benchmem, the result
also shows the number of allocations we made for each request.
You might wonder, how come we are able to handle 776K requests per second when
running it from Golang’s benchmark framework, but we only get about 28K requests
per second on redis-benchmark? The latency also differs quite a lot; using
redis-benchmark shows that the latency is about 5ms, while using Golang’s
testing framework it’s about 1,289 nanoseconds. Well, for latency, they use
different metrics. redis-benchmark shows the median, but the Golang’s testing
framework shows the average. The difference is expected, but in our case, the
differences are huge, so it’s a little suspicious.
TCP Overhead
Let’s analyze what is happening here. How is benchmarking using Golang’s
framework outperforming redis-benchmark by a lot? In theory, they shouldn’t,
since they are practically doing the same thing. We can start questioning
ourselves about what is different between our benchmark vs redis-benchmark.
One difference is that our benchmark is using a unix sockfile instead of an
actual TCP connection. By using a sockfile, we reduce some overhead done by TCP.
Let’s try to use a TCP connection instead of a unix sockfile.
1func BenchmarkRedisSet(b *testing.B) {
2    ...
3    listener, err := net.Listen("tcp", "0.0.0.0:3900")
4    ...
5    b.RunParallel(func(pb *testing.PB) {
6        client, err := net.Dial("tcp", "localhost:3900")
7        ...
8    })
9}
Now, let’s run our benchmark again:
1❯ go test . -v -bench=BenchmarkRedisSet -benchmem -benchtime=10s -run="^$"
2goos: linux
3goarch: amd64
4pkg: github.com/jauhararifin/goredis
5cpu: AMD Ryzen 9 7900X 12-Core Processor
6BenchmarkRedisSet
7BenchmarkRedisSet-24             7970709              1620 ns/op            617151 ops/sec           615 B/op         42 allocs/op
8PASS
9ok      github.com/jauhararifin/goredis 14.783s
As you can see, the throughput drops a little. Previously it was 776K ops/sec,
now it is 617K ops/sec. It drops about 20%. However, it’s still much higher than
the benchmark result from redis-benchmark. The redis-benchmark only reaches
about 28K ops/sec, about 20x smaller than our current benchmark. Let’s analyze
further.
Logging Overhead
The second thing that differentiates between our benchmark and redis-benchmark
is that we don’t log anything in our test. If you notice, in the benchmark logic
above, I initialize the logger like this:
1noopLogger := slog.New(slog.NewTextHandler(io.Discard, nil))
You see, I put io.Discard as the log destination. This means whenever we log
something, it will just be dropped and not written anywhere. This is not what we
did when benchmarking with redis-benchmark. If you notice, in our main
function, I initialize the logger by doing this:
1logger := slog.New(slog.NewTextHandler(os.Stderr, &slog.HandlerOptions{Level: slog.LevelDebug}))
When we benchmark using redis-benchmark, we use os.Stderr as the log
destination. And if you notice, every time we handle a SET and GET request,
we log its parameters. This means when we benchmark our code using
redis-benchmark, we add extra overhead by logging it, while we don’t have that
overhead in our benchmark code that uses Golang’s testing framework.
Let’s see how our benchmark performs if we also use os.Stderr to print our
log. We also use slog.LevelDebug as the log level so that our debug print will
be printed.
1noopLogger := slog.New(slog.NewTextHandler(io.Stderr, nil))
1❯ go test . -v -bench=BenchmarkRedisSet -benchmem -benchtime=10s -run="^$"
2...
3time=2025-02-03T04:01:09.250+07:00 level=DEBUG msg="SET key into value" key=z&k1:4QJIKHh value=PJNL-B4HTz@ clientId=14
4time=2025-02-03T04:01:09.250+07:00 level=INFO msg="closing client" clientId=14
5BenchmarkRedisSet-24             1434164              8348 ns/op            119787 ops/sec           601 B/op         43 allocs/op
6PASS
Now our benchmark result matches the one we did using redis-benchmark. We
still have different results for the latency, but this is expected because we
are reporting different metrics here. Here, the latency is the average latency
while redis-benchmark reports the median of the latency. Neither metric is a
good measure of latency, but we won’t be focusing on that too much for now.
I will keep using unix sockfile and turn off the logging for benchmarking
purposes. This is because we want to focus on Redis itself instead of the
overhead of TCP and logging. In the real world, we don’t usually enable debug
logs; we usually only log when a client is connected or disconnected. So,
disabling the log here makes more sense because it mimics what we’ll be doing in
a production environment. We also use sockfile instead of TCP connection here
because there is not much we can do with TCP connection. In the end, the
performance of TCP depends on many external factors as well, such as the cable
we are using, how far apart the client and server are, etc. There is technically
something we can do to reduce the overhead of TCP connection like using
io_uring, but I won’t
cover that in this article because it’s quite involved and this article is
supposed to be an introduction.
Profiling
To improve the performance of an application, you need to know where the bottleneck is. You need to identify what makes your app slow or has low throughput. You don’t want to improve your app on things that don’t matter. Applications consist of multiple parts working together. Sometimes, it’s not obvious which component we should improve. Improving a component that plays a little role in the whole application performance won’t give us meaningful performance improvement. For example, in our Redis server, there is logic to accept client connections, read their requests, process the requests, and send back the responses. Improving things like accepting client connection logic or shutdown logic won’t increase our throughput or reduce our latency.
The more complex your application, the harder it is to find the performance bottleneck. Fortunately, we can profile our code to find it. We will first focus on CPU profiling. There are other types of profiling like memory profiling, block profiling, mutex profiling, etc. Conceptually, what CPU profiling does is just sample our CPU periodically. When we run our benchmark and turn on the CPU profiler, Golang’s runtime will periodically snapshot our CPU position. It records what function our CPU is currently on (for each thread). So after the benchmark finishes, we will have a file containing the list of samples. Each sample basically is just a stacktrace of the function that our CPU is currently executing at that moment. The idea is: if there is a particular function that is sampled many times (compared to other functions), then this function must be the bottleneck. The more a function is sampled, the more our CPU is spending its time there. So, it makes sense that those functions could be the bottleneck of our application. This is not always the case, though. Some other types of applications might have bottlenecks on the network. When that happens, our CPU won’t do anything meaningful. If our app is slow because its internet speed is slow, then our CPU doesn’t actually do anything, and the result of CPU profiler won’t be meaningful.
Most programming languages have ways to help us profile our code. Profiling in
Golang is quite straightforward as well. You can add -cpuprofile=cpu.out to
enable CPU profiling during benchmark test. Once the benchmark is finished, you
will have a cpu.out file containing all the sampled CPU positions.
 1❯ go test . -v -bench=BenchmarkRedisSet -benchmem -benchtime=10s -cpuprofile=cpu.out -run="^$"
 2goos: linux
 3goarch: amd64
 4pkg: github.com/jauhararifin/goredis
 5cpu: AMD Ryzen 9 7900X 12-Core Processor
 6BenchmarkRedisSet
 7BenchmarkRedisSet-24             8788383              1436 ns/op            696278 ops/sec           600 B/op         42 allocs/op
 8PASS
 9ok      github.com/jauhararifin/goredis 14.241s
10❯ ls -l cpu.out
11-rw-rw-r-- 1 jauhararifin jauhararifin 52565 Feb  3 06:47 cpu.out
As you can see above, after you run the benchmark test, you will have a file
called cpu.out. This file contains the result of the CPU profiling. There are
a bunch of ways to analyze this file. Go itself has a tooling we can use to
analyze it, you can execute go tool pprof cpu.out to analyze it:
1❯ go tool pprof cpu.out
2File: goredis.test
3Type: cpu
4Time: Feb 3, 2025 at 6:50am (WIB)
5Duration: 12.97s, Total samples = 251.16s (1935.99%)
6Entering interactive mode (type "help" for commands, "o" for options)
7(pprof)
Once you run the above command, you can interact with the pprof tool to analyze
it. For example, you can write top 10 to find the top 10 functions that have
been sampled by CPU profiler.
 1(pprof) top 10
 2Showing nodes accounting for 196.87s, 78.38% of 251.16s total
 3Dropped 298 nodes (cum <= 1.26s)
 4Showing top 10 nodes out of 70
 5      flat  flat%   sum%        cum   cum%
 6   166.71s 66.38% 66.38%    166.71s 66.38%  runtime/internal/syscall.Syscall6
 7     5.21s  2.07% 68.45%      5.21s  2.07%  runtime.(*timeHistogram).record
 8     3.92s  1.56% 70.01%      3.92s  1.56%  runtime.procyield
 9     3.66s  1.46% 71.47%      4.68s  1.86%  runtime.deductAssistCredit
10     3.52s  1.40% 72.87%     12.30s  4.90%  runtime.exitsyscall
11     3.47s  1.38% 74.25%    164.78s 65.61%  internal/poll.(*FD).Read
12     3.08s  1.23% 75.48%    136.93s 54.52%  github.com/jauhararifin/goredis.readOne
13     3.07s  1.22% 76.70%     11.85s  4.72%  runtime.mallocgc
14     2.16s  0.86% 77.56%      7.49s  2.98%  runtime.casgstatus
15     2.07s  0.82% 78.38%      4.45s  1.77%  runtime.reentersyscall
From the result above, you can see 10 lines of output, each line representing a
sampled function. You can see the first line is for the function
runtime/internal/syscall.Syscall6. This is the function used by Go’s runtime
to perform syscall. There are about
5 numbers on the left side of the function name. Those 5 numbers are basically
rooted in 2 sources, the flat and cum. The flat% is basically the same as
flat, but in percentage format. The same applies to cum and cum%.
flat represents how long your CPU spends its time inside that function. Higher
numbers mean that your CPU takes a lot of time executing that function. But, it
doesn’t count any function it called. So, if you have a function foo that
calls another function bar, the execution of bar won’t be counted in the
flat. For example, if let’s say you have a function that takes a slice of
integers and filters the prime numbers from that slice, you might write that
function like this:
 1func filterPrime(s []int) []int {
 2    result := make([]int, 0, len(s))
 3    for _, x := range s {
 4        if isPrime(x) {
 5            result = append(result, x)
 6        }
 7    }
 8    return result
 9}
10
11func isPrime(x int) bool {
12    ...
13}
The execution of isPrime won’t be counted in the flat number. So if let’s
say your filterPrime takes 10 seconds to finish, but the isPrime itself is
executed for 8 seconds, your flat number on filterPrime will be 2 seconds.
The flat% is just the percentage of total CPU time. In the report above, you
see the first line says that you have 251.16 seconds of profile data. This is a
little bit misleading because you remember we only ran the benchmark test for
14.241 seconds. Well, this is because CPU time is not the same as wall-clock
time. CPU time measures the time used by CPU, not elapsed time. On my PC, I have
about 24 CPUs, which means each CPU takes about 10 seconds. Of course, this is
just an approximation; one CPU might execute more instructions than the others.
Ok, back to the flat%. You see the flat number in the first function is
166.71 seconds. If you divide it by the total profiling time (251.16 seconds),
you will get 66.38%, which is the number of flat%.
The sum% is basically just the sum of flat%. The value of sum% of the 5th
row is the sum of flat% at 1st, 2nd, 3rd, 4th, and 5th rows.
1            flat%   sum%
2        +--66.38% 66.38%                    runtime/internal/syscall.Syscall6
3        |   2.07% 68.45%                    runtime.(*timeHistogram).record
4sum up -+   1.56% 70.01%                    runtime.procyield
5to      |   1.46% 71.47%                    runtime.deductAssistCredit
672.87%  +---1.40% 72.87%                    runtime.exitsyscall
7                  ^
8                  |
9                  +-- here 72.87% was the sum of 66.38% + 2.07% + 1.56% + 1.46% + 1.40%
Now, let’s talk about cum. cum is actually pretty straightforward. It’s the
cumulative sample from a function and any other function it called. Let’s use
the filterPrime function above. While flat shows how long the CPU spends its
time on that function only, cum shows how long the CPU spends its time on
that function plus any other function called by it. So, if our filterPrime
runs for 10 seconds, and the isPrime alone takes 8 seconds, then the cum
will be 10 seconds.
There are a bunch of other commands you can use other than top 10 to analyze
the profiling result. One of my favorites is the web command. If you run web
command, a browser will be opened showing the result in graphical format.

Similarly, each box in the graph represents a single function. Boxes with redder
color mean their cum number is bigger. The greyer color means its cum number
is smaller. You can see, each box has some numbers as well. For example, in
goredis.readObject box, there is 0.36s (0.14%) of 135.92s (54.12%), this shows
the flat and cum numbers. While the color shows the magnitude of cum
value, the font size shows the magnitude of flat value. So, bigger flat
numbers will be represented as bigger font.
Now, apart from the box, if you use graphical representation, you will also see arrows pointing from one box to another box. These arrows represent function calls. Take a look at the picture below:

In the above picture, there are 3 arrows coming out of goredis.readObject, and
those arrows point to runtime.convTstring, goredis.readBulkString, and
goredis.readOne. This means that goredis.readObject calls those 3 functions.
A function might not be shown in the graph if it’s too small. So, be aware that
if you don’t see a function in the profiling graph, it doesn’t mean it’s not
being called.
Now, notice that each arrow has a text containing a duration. This duration
represents the time our CPU takes to execute the function called by
goredis.readObject. If you sum up the flat number of goredis.readObject
and the numbers of the arrows, you will get: 0.36s + 1.64s + 117.21s + 16.71s =
135.92s which is the same as the cum number of goredis.readObject.
The arrows also have different thicknesses and colors. Red arrows mean the CPU takes more time executing that path. You can think that the color represents the number of the arrow. Thick arrows mean that the CPU takes a lot of time executing that path.
Using graph representation can help us trace back the origin of our bottleneck.
We can see here that the syscall takes a lot of CPU time and it is coming
originally from readArray.
There is one more way you can analyze the CPU profiling result: you can use
speedscope. You can drag and drop your cpu.out
file to this app and it will show you a flamegraph.

Similarly, each block in this graph represents a function. If you notice, the
blocks are stacked on top of each other. The stack represents a function call.
Wider blocks mean the CPU takes more time executing that block. You can also
find the cum and flat values in the bottom left corner of the graph.
Well, there are still other ways to visualize the CPU profiling result, but we will focus on the three methods above.
Syscall
Let’s go back to our CPU profile graph.

You will see that the box with the biggest font is syscall.Syscall6. This
indicates that our CPU spends a lot of time there. And if you look carefully,
this syscall originates from readArray, which calls readObject,
readBulkString, readLength, readOne, and then calls (*net.conn).Read.
So, the CPU spends a lot of time reading the client’s request and parsing it.
The parsing part is actually not that bad, judging from the flat value of
readArray, readObject, readBulkString, readLength, and readOne. All of
them executed less than 1% of the CPU time. The biggest contribution is actually
from syscall.Syscall6. What is this syscall.Syscall6?
You can think of a syscall as an
API for the kernel. Your computer most likely runs on an operating system. The
kernel is part of the operating system. It manages the resources in your
computer. CPU, memory, and storage are some of the resources it handles. It also
helps us talk to other hardware like monitors, printers, and keyboards through
drivers. Our application is like an isolated environment where we perform some
basic tasks like adding two numbers, looping, calling a function, etc. But when
it comes to allocating memory, showing something on the screen, listening to a
socket, or sending data to other processes, we can’t do those alone without the
kernel. Syscall is an API to talk to the kernel to do all of that. There are
syscalls for allocating memory, writing to a file, receiving bytes from other
processes, sending TCP packets through network interfaces, etc. In Go,
syscall.Syscall6 has this signature:
1func Syscall6(trap, a1, a2, a3, a4, a5, a6 uintptr) (r1, r2 uintptr, err Errno)
It accepts a bunch of integers and returns two integers and an error code. These numbers are the parameters of the syscall. One of the numbers might represent what kind of syscall we want to call. There is a code to call syscall to write a file, another code to allocate memory, etc. One of the parameters might also contain what file we want to read, or which address we want to write to, etc. We won’t go into too much detail on these parameters. You just need to know they’re there.
Now, the problem with syscalls is that they are quite slow. It won’t be that bad if you call syscalls fifty or a hundred times. But if you call them millions of times, the overhead adds up. Unlike an ordinary function call, syscalls have additional overhead. Your CPU needs to switch to kernel space, which means all of your application states need to be preserved during the syscall and restored after the syscall finishes. It also needs to switch into a higher privilege level in the CPU, and this has its own overhead too. Some syscalls like reading data from a socket also need to copy the data from kernel buffer to user buffer. There are other overheads that I don’t mention here, but the point is they have big overhead.
Buffered Reader
One trick to improve performance is by making expensive operations less
frequent. We can consider syscalls as expensive operations here. In our code,
when we parse the request from the client, we use the readOne helper function
that reads one byte from net.Conn. Reading a byte from net.Conn requires one
syscall. If we read 10 bytes, then we need 10 syscalls. This overhead adds up
and makes our application slower. To reduce the overhead, we can batch bytes
together. For example, instead of asking for one byte at a time, we read 1000
bytes at once using one syscall. We can store those 1000 bytes in a []byte in
our app. Whenever we need to read a byte, we just check our local []byte. If
it has a byte, then we read from it. But if it’s empty, we use syscall again to
read another 1000 bytes. By doing this, reading 2000 bytes doesn’t have to use
2000 syscalls; we can just use 2 syscalls. That sounds great, but why limit it
to 1000? Why don’t we just read 1 million bytes in one syscall? Well, smaller
batch sizes mean more syscalls, which means a lot of overhead. But bigger batch
sizes mean we need more memory to store it, and a single syscall might take
longer. If we use a very big batch size, the available bytes might not be able
to catch up to our consumption. We might read it faster than the client sends
it, which is not really a problem, but we will waste some memory. People often
use 4096 as the batch size. This is because that’s usually the minimum size of
the buffer that resides in the kernel. Also, it’s the size of a single memory
page, which means we can map it into a single entry in the
page table. I personally don’t have
a very strong opinion on this number. If you want to get the best number, you
can just experiment with it. If your server and client are in the same data
center, you might have more throughput with a bigger batch size because your
bandwidth is bigger.

Fortunately, Go has a really nice standard library that can help us with this.
We can use bufio.Reader to do this.
bufio.Reader does what I described above. It wraps an io.Reader and buffers
it. By default, bufio.Reader uses 4096 bytes to buffer the read bytes. To use
bufio.Reader, we can just call bufio.NewReader(...) and pass our net.Conn
(remember, net.Conn is an io.Reader as it implements the Read function).
 1func (s *server) handleConn(clientId int64, conn net.Conn) {
 2    ...
 3    // We wrap the conn with bufio.NewReader.
 4    // Now, every `Read` call will use the buffer provided by bufio.Reader
 5    // until there are no more available bytes. Once the buffer is empty,
 6    // it will call `conn.Read` to fill in the buffer again.
 7    reader := bufio.NewReader(conn)
 8    for {
 9        // Now we use the wrapper connection instead of the original `conn`.
10        request, err := readArray(reader, true)
11        ...
12    }
13    ...
14}
That’s it. We just wrap the conn with bufio.Reader and it should be done.
You can check the code in
this commit.
Next, let’s run the benchmark again to see the result.
1❯ go test . -v -bench=BenchmarkRedisSet -benchmem -benchtime=10s -cpuprofile=cpu.out -run="^$"
2goos: linux
3goarch: amd64
4pkg: github.com/jauhararifin/goredis
5cpu: AMD Ryzen 9 7900X 12-Core Processor
6BenchmarkRedisSet
7BenchmarkRedisSet-24            11713911               903.7 ns/op         1106589 ops/sec           566 B/op         42 allocs/op
8PASS
9ok      github.com/jauhararifin/goredis 11.868s
Now, our throughput is about 1.1 million SET operations per second. That’s a
40% improvement from the previous 776K SET operations per second.

If you check the benchmark result again, now readArray is not the bottleneck
anymore.
Premature Optimization: Buffered Writer
Remember, the key to improving your app’s performance is identifying your bottleneck first. Improving the performance in places that are not bottlenecks won’t give you much performance improvement. There is nothing wrong with improving things out of context if it’s a low-hanging fruit. Maybe you can improve your app performance by 1% by just adding one line of code; that’s fine. It’s not a difficult thing to do, so you might as well do it. But if the improvement is very complex and it is not the bottleneck, you might end up wasting a lot of time for just 1% of performance improvement.
On some occasions, improving your performance by 1% can matter, especially when you’re working on a very performance-critical system like a database or operating system.
Since our read is now buffered, we may think that it makes sense to buffer our write as well. When we send a response to the client, we can put it in a buffer first and send it only when the buffer is full. By doing this, we will have a smaller number of syscalls to send the response.
However, unlike making a buffered reader, making a buffered writer is not as
easy as wrapping our connection with
bufio.Writer. The way bufio.Writer works
is similar to bufio.Reader. It allocates a slice of bytes in our application
memory and writes the data there instead of directly to the underlying writer.
In our case, if we wrap our connection with bufio.Writer, we will write to
local bytes first and send it through the socket interface once the buffer is
full. This is not what we want. If we do it naively like this, there might be
some messages that will never be sent to the socket. Imagine our bufio.Writer
uses 4096 bytes for its buffer size. Now, let’s say there is a client sending
SET "key1" "value" to our server. As a result, our server needs to send back
OK. Now, instead of sending it through the socket, we write it to our local
buffer. Because OK is just 2 bytes (not 4096 or more), the bufio.Writer
won’t send it through the socket connection and we’re stuck here.
As an analogy, imagine you want to ride a roller coaster in a theme park. The roller coaster runs for about 5 minutes. To maximize utility, you want to wait until the roller coaster is full before you run it. This works pretty well when it’s crowded. But imagine when the theme park is not very crowded; there might be only 2 people who want to ride the roller coaster. In this case, the roller coaster will never be full and it will never run.
In order to solve the above problem, we need to have some timeout. Instead of waiting until the buffer is full, we need to limit our waiting time to some timeout, let’s say 10ms. So, if in 10ms the buffer is not full, we should send it anyway. This design, however, has some downsides. Now, for a response to be sent, it has to wait at most 10ms. If our traffic is high, our buffer might be full faster than 10ms and we get a lot of improvement there. But if our traffic is very low, a single request might take 10ms before the response itself is sent. This tradeoff is something you should be aware of before doing performance improvement. You should ask yourself whether it’s okay to increase the latency a little bit in order to get more throughput. In some cases, it might not be okay. In other cases, it might be okay.
There is a similar algorithm in computer networking called Nagle’s algorithm. Basically, when sending a packet through TCP, we can delay it first so we can send more packets. The details are a little bit different. It doesn’t use timeout as a fallback mechanism, but the idea is similar.
Let’s start by creating a buffered writer struct:
 1type bufferWriter struct {
 2    w    io.Writer
 3    buff []byte
 4    n    int
 5}
 6
 7func newBufferWriter(w io.Writer) *bufferWriter {
 8    return &bufferWriter{
 9        w:    w,
10        buff: make([]byte, 4096),
11        n:    0,
12    }
13}
Let’s continue implementing the Write method:
 1func (b *bufferWriter) Write(buff []byte) (int, error) {
 2    totalWrite := 0
 3    for len(buff) > len(b.buff)-b.n {
 4        var n int
 5        if b.n == 0 {
 6            n, _ = b.w.Write(buff)
 7        } else {
 8            n = copy(b.buff[b.n:], buff)
 9            b.n += n
10            _ = b.flush()
11        }
12        totalWrite += n
13        buff = buff[n:]
14    }
15    n := copy(b.buff[b.n:], buff)
16    b.n += n
17    totalWrite += n
18    return totalWrite, nil
19}
20
21func (b *bufferWriter) flush() error {
22    panic("todo")
23}
In the above code, the logic is pretty straightforward. We are going to write
the data in the buff parameter to our buffer. If adding the buff to an
existing buffer will make the buffer full, we just put part of buff to our
buffer so that our buffer becomes full and then flush it. We have a special case
where our internal buffer is empty. In this case, we can just write the whole
buff directly. The rest of the code is straightforward; you just need to put
the remaining buff to the internal buffer and update the metadata.
Implementing the flush function is quite straightforward as well:
 1func (b *bufferWriter) flush() error {
 2    if b.n == 0 {
 3        return nil
 4    }
 5
 6    n, err := b.w.Write(b.buff[:b.n])
 7    if n < b.n && err == nil {
 8        err = io.ErrShortWrite
 9    }
10    if err != nil {
11        if n > 0 && n < b.n {
12            copy(b.buff[0:b.n-n], b.buff[n:b.n])
13        }
14        b.n -= n
15        return err
16    }
17    b.n = 0
18    return nil
19}
To flush our internal buffer to the socket, we just need to call b.w.Write and
pass our buffer. This might work well if our underlying writer is a socket. But
let’s think bigger and assume that the internal writer can be any writer. When
we call b.w.Write, it returns an integer n indicating how many bytes are
written. This n is not guaranteed to be as big as the bytes we pass to
b.w.Write; it can be less. When this happens, we want to return an error,
io.ErrShortWrite to be precise, and update our internal buffer so that it only
includes the bytes that failed to be written. This is technically unnecessary
for our use case, but it’s nice to have more generic functions like this.
Now, so far we’ve implemented the buffered writer like bufio.Writer. We
haven’t added the timeout yet. We can spawn a separate goroutine that will flush
our buffer every 10ms. Note that I pick 10ms as the timeout out of thin air
here. You might wonder, why not 1ms or 20ms? Well, there is no particular reason
for that. You want the number to be big enough so that it can gather a lot of
bytes before it sends them to the socket. But it also needs to be small enough
so that your latency won’t be that bad.
One thing that you need to be careful about here is race conditions. Now because we spawn a new goroutine that flushes the buffer periodically, there is now a chance that two goroutines will access our local buffer concurrently. You need a lock to avoid this problem.
Periodically calling flush also has another problem. Now, your CPU needs to
wake up every 10ms and check whether there are bytes in the buffer that can be
sent through the socket. You might think that 10ms is not that bad, but actually
if you have 1000 clients, your CPU might need to wake up way more often than
10ms. So, instead of doing that, let’s make the CPU completely sleep when the
buffer is empty. Only when someone fills it with some bytes do we want to start
the 10ms timer to send the message. So, if nothing is written to the local
buffer, we just sleep endlessly. Once something is written to the local buffer,
we will wake up, wait for 10ms and send the buffer through the socket if the
buffer is not empty.
To implement the above idea, we can use the sync.Cond utility provided by
Golang. sync.Cond is almost like sync.Mutex. You can acquire a lock using
.Lock() just like sync.Mutex. You can also unlock it using .Unlock().
Additionally, it provides two more methods, which are .Wait() and .Signal().
Well, actually it also has one more method called Broadcast, which is almost
like Signal(), but we won’t be using that.
So, what does Wait() do? It’s a little bit complex, so buckle up. In order to
call Wait, you must first lock the sync.Cond. If you call Wait without
locking the sync.Cond, a panic will be raised. Now, calling Wait will unlock
the sync.Cond (remember, you need to lock the sync.Cond before calling
Wait), and pause the current goroutine until someone calls Signal or
Broadcast. So, once you call Wait, the lock will be released and you will be
sleeping until Signal is called to wake you up. Once you are woken up by
someone that calls Signal, you will acquire the lock of sync.Cond again.
Notice that before you call Wait(), you have the lock and you will have the
lock again after the Wait() returns. So, apparently, this property is very
useful to wait for some condition. That’s why it’s called Cond and the method
is called Wait.
What do I mean by “wait for some condition”? Let’s use our example. Remember we
want to spawn a new goroutine that will periodically flush the buffer? Let’s
call that goroutine the “flusher goroutine”. As an optimization, we want our
flusher goroutine to just sleep when the buffer is empty. Only when the buffer
is filled do we want to wait for 10ms to flush its content. “When the buffer is
filled” is what we call the condition. In other words, our condition is
b.n == 0. To sleep when a condition is met, you can use this pattern:
1cond.Lock()
2for checkTheCondition() {
3    c.Wait()
4}
5// At this line, the condition is false, and you can do anything you want here
6cond.Unlock()
Later, somewhere, you should call Signal if you change the condition. So for
our case, the flusher goroutine will look like this:
 1func (b *bufferWriter) Start() error {
 2    b.cond.L.Lock()
 3    for b.n == 0 {
 4        b.cond.Wait()
 5    }
 6
 7    time.Sleep(10 * time.Microsecond)
 8
 9    // Note that because flush accesses b.buff, we must call it
10    // while holding the lock
11    if err := b.flush(); err != nil {
12        b.cond.L.Unlock()
13        return err
14    }
15    b.cond.L.Unlock()
16}
In the code above, we will sleep as long as b.n == 0. Once someone signals us,
we check again if b.n == 0. If it’s still true, we sleep again. Until one day
someone signals us and b.n > 0, we start to sleep for 10ms and flush the
buffer. There is a little problem here. We call time.Sleep while holding the
lock. This is not okay because this means while we are sleeping, other
goroutines can’t do anything that requires the lock. But we don’t actually need
the lock because we’re just sleeping. So we don’t want to block other people
from acquiring the lock. To fix that issue, we can unlock the condition before
sleeping:
 1func (b *bufferWriter) Start() error {
 2    b.cond.L.Lock()
 3    for b.n == 0 {
 4        b.cond.Wait()
 5    }
 6
 7    b.cond.Unlock()
 8    time.Sleep(10 * time.Microsecond)
 9    b.cond.Lock()
10
11    // Note that because flush accesses b.buff, we must call it
12    // while holding the lock
13    if err := b.flush(); err != nil {
14        b.cond.L.Unlock()
15        return err
16    }
17    b.cond.L.Unlock()
18}
Unfortunately, the above code still has a problem. It only runs once. We want it to run infinitely. Let’s fix that:
 1func (b *bufferWriter) Start() error {
 2    for {
 3        b.cond.L.Lock()
 4        for b.n == 0 {
 5            b.cond.Wait()
 6            b.cond.L.Unlock()
 7            time.Sleep(10 * time.Microsecond)
 8            b.cond.L.Lock()
 9        }
10        if err := b.flush(); err != nil {
11            b.cond.L.Unlock()
12            return err
13        }
14        b.cond.L.Unlock()
15        // This unlock is immediately followed by Lock on line 3 above
16        // Can you improve this function so that we don't have to Unlock here?
17    }
18}
This implementation is still not perfect yet because we haven’t implemented the graceful shutdown feature yet. But let’s not make it too complicated.
Next, we just need to update our Write method so that it calls Signal
whenever it writes a message that makes the buffer not empty.
 1func (b *bufferWriter) Write(buff []byte) (int, error) {
 2    // notice that since now our buffer can be accessed by
 3    // the flusher goroutine, we need to acquire the lock first
 4    // before accessing it
 5    b.cond.L.Lock()
 6    defer b.cond.L.Unlock()
 7    ...
 8    // now, after every write, we need to call Signal so that
 9    // our flusher goroutine will wake up from its sleep, check
10    // whether the buffer is empty, and start the 10ms timer to
11    // flush the buffer if it's not empty.
12    b.cond.Signal()
13    return totalWrite, nil
14}
Now we just need to wire our buffered writer to the TCP connection:
 1func (s *server) handleConn(clientId int64, conn net.Conn) {
 2    ...
 3    writer := newBufferWriter(conn)
 4    go func() {
 5        // We haven't handled the shutdown here. Ideally, when the client is
 6        // disconnected, we should call writer.Shutdown() and cleanup the
 7        // flusher goroutine so that it won't cause memory leak.
 8        if err := writer.Start(); err != nil {
 9            s.logger.Error(
10                "buffered writer error",
11                slog.Int64("id", clientId),
12                slog.String("err", err.Error()),
13            )
14        }
15    }()
16    ...
17}
Let’s try to benchmark our redis server again.
1❯ go test . -v -bench=BenchmarkRedisSet -benchmem -benchtime=10s -cpuprofile=cpu.out -run="^$"
2goos: linux
3goarch: amd64
4pkg: github.com/jauhararifin/goredis
5cpu: AMD Ryzen 9 7900X 12-Core Processor
6BenchmarkRedisSet
7BenchmarkRedisSet-24            13776495               963.5 ns/op         1037839 ops/sec           640 B/op         42 allocs/op
8PASS
9ok      github.com/jauhararifin/goredis 14.556s
Now, we got 1.037 million SET operations per second. It’s not much of an
improvement, is it? In fact, we actually perform worse. If you run the benchmark
multiple times, some of them might perform better and some might perform worse,
but the difference is not that significant. What’s going on here? Well, this is
because writing was never the bottleneck. We haven’t checked what’s the
bottleneck of our application and jumped into an idea to buffer the write
operations. There are other bigger bottlenecks in our application, and the
overhead of write operations is very small compared to those. Improving the
write won’t give you more throughput if you don’t address the bigger bottleneck.
As you can see, all of that work was just wasted without any meaningful
performance improvement. This is why profiling our application before making
performance improvements is very important.
Lock Contention
Let’s actually find the bottleneck, shall we? Let’s open the cpu.out on the
speedscope app.
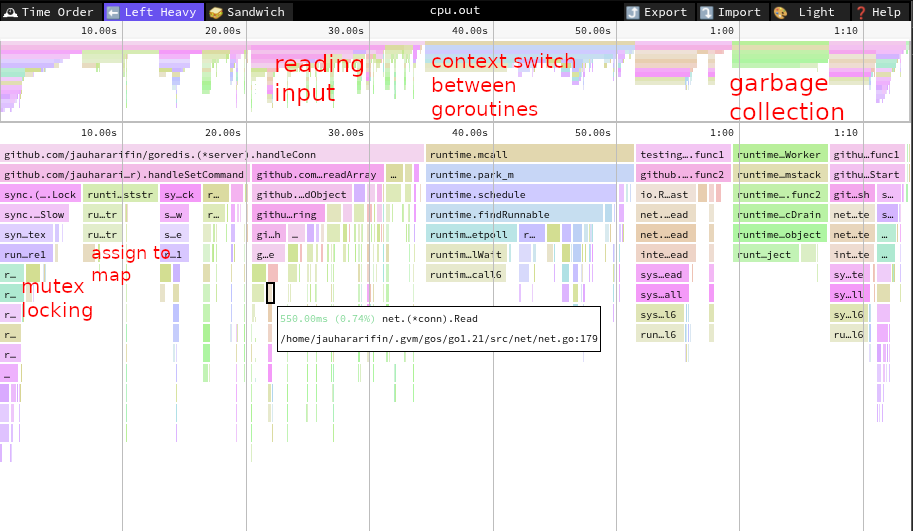
Now, you can see that things are not as straightforward as before. There are
several blocks that look large, but not super large. In the topmost boxes, you
can see the largest box is handleConn, which makes sense because that’s the
thing we are trying to optimize. Looking at handleConn alone won’t help us
that much. There’s a lot going on inside handleConn - which one is the
bottleneck? Well, to answer that, you can see the box below handleConn. The
biggest box below handleConn is handleSetCommand, which makes sense, as
that’s the command we’re currently benchmarking. You can double click
handleSetCommand to zoom in.
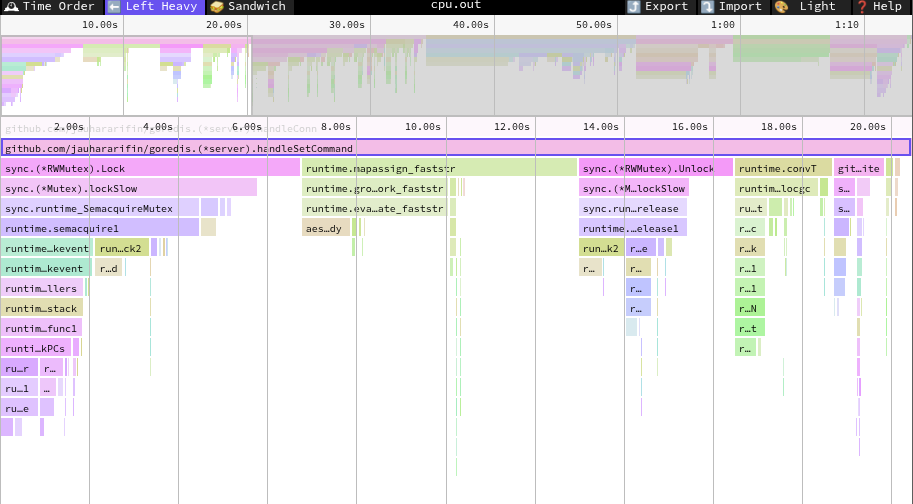
You can see in the flamegraph that the CPU spends most of its time on
sync.(*RWMutex).Lock, runtime.mapassign_faststr, and
sync.(*RWMutex).Unlock. We know sync.(*RWMutex).Lock is the function we use
to acquire the mutex lock and sync.(*RWMutex).Unlock is the function we use to
release the lock. Apparently, when we handle the SET command, we spend most of
our time locking and unlocking the mutex. We can consider this as one of our
potential bottlenecks. I use the word “potential” here because sometimes there
are things that we have to do and can’t be removed. We don’t know yet whether we
can improve or remove the mutex locking here. Spoiler alert: we can. But
sometimes, knowing the bottleneck itself is just half of the story. Addressing
the bottleneck is another story. OK, so we know one potential bottleneck, i.e.,
locking the mutex.
At this point, you may ask why locking the mutex is so expensive. To answer that
question, we need to look into how it works behind the scenes. We know that
accessing a memory region concurrently can cause race conditions, and it’s not
OK. So, things like sync.Mutex might seem like an impossible data structure to
implement. Well, actually, accessing the same memory region can be safe if
you’re using atomic operations. There are a bunch of atomic operations provided
by sync/atomic. These are special functions
that will be translated into special instructions in the CPU. With these
operations, you can concurrently access the same memory region safely.
Unfortunately, there are not a lot of atomic instructions we can use. We will
focus on one instruction for now, i.e., CompareAndSwapInt32. The logic of
CompareAndSwapInt32 is something like this:
 1// This is the illustration of how CompareAndSwapInt32 behaves.
 2// This is not the actual implementation of CompareAndSwapInt32
 3// because the implementation below can cause data race when
 4// called concurrently. In practice, every call to
 5// CompareAndSwapInt32 will be translated into special CPU
 6// instruction that performs the operations below, but atomically.
 7func CompareAndSwapInt32(addr *int32, oldV, newV int32) bool {
 8    if *addr == oldV {
 9        *addr = newV
10        return true
11    }
12    return false
13}
The above code shows roughly the internal logic of CompareAndSwapInt32.
However, those operations happen atomically. So calling CompareAndSwapInt32 on
the same address concurrently will never cause a race condition. Suppose we have
an int32 variable called x with a value of 100. Two goroutines call
CompareAndSwapInt32 on variable x:
 1var a, b bool
 2
 3// goroutine A:
 4go func() {
 5    a = atomic.CompareAndSwapInt32(&x, 100, 200)
 6}()
 7
 8// goroutine B:
 9go func() {
10    b = atomic.CompareAndSwapInt32(&x, 100, 300)
11}()
If both goroutine A and B happen to execute the CompareAndSwapInt32 at the
same time, what will happen is: one of them will succeed, and one of them will
fail. The successful call to CompareAndSwapInt32 will return true, and the
failed one will return false. So, in the above example, the final outcomes
after both goroutines execute are either:
a == trueandb == falseandx == 200, ora == falseandb == trueandx == 300.
You can think that either the operation in goroutine A is executed first or the operation in goroutine B is executed first. This is called sequential consistency. Go memory model guarantees sequential consistency access. Other programming languages like C++ and Rust have more flexible memory models.
So, let’s get back to the question of how mutex works behind the scenes. Well,
we can have a single integer that represents the mutex state; it can be locked
or unlocked. To lock the mutex, we can use
atomic.CompareAndSwapInt32(&the_state, 0, 1) to switch the mutex from unlocked
state to locked state. If the CompareAndSwapInt32 returns true, that means
we’ve successfully locked the mutex. In this case, we can just return. This is
called the fast-path of mutex locking. CompareAndSwapInt32 is pretty fast;
it’s almost like just assigning a value to a variable. If we don’t get the lock
right away, we will lock the mutex in the slow-path.
 1type Mutex struct {
 2    state int32
 3}
 4
 5func (m *Mutex) Lock() {
 6    // Fast path: grab unlocked mutex.
 7    if atomic.CompareAndSwapInt32(&m.state, 0, 1) {
 8        return
 9    }
10    m.lockSlow()
11}
12
13func (m *Mutex) lockSlow() {
14    ...
15}
What happens in the slow path? Well, one way we can do it is just check the
state over and over again and try to swap it from 0 to 1 until we succeed.
1func (m *Mutex) lockSlow() {
2    for {
3        if atomic.CompareAndSwapInt32(&m.state, 0, 1) {
4            break
5        }
6    }
7}
However, this is a very bad implementation of Mutex. This implementation is
called spin-lock. This is bad because
it wastes our CPU cycles just to check whether our mutex is released and we are
able to lock it. To improve this, we can just sleep until woken up by another
goroutine that unlocks the mutex. But it’s not that simple. What if the mutex is
unlocked right before we have the chance to sleep? Our goroutine will end up
sleeping forever. To address this issue, Go uses
semaphore. Semaphore
is like a counter that we can wait on. When we wait on a semaphore, we will
decrease the counter in the semaphore by one and sleep if the new counter is
negative. This will happen atomically. On the other side, we can send a signal
to the semaphore to increase the counter. We can use this to unlock the mutex. I
won’t go into more detail on the code because it’s quite involved. You can check
the
lockSlow implementation
yourself for the details.
There is one more problem. Making the goroutine sleep is not easy. Our goroutine is managed by the Golang runtime. Behind the scenes, there is this thing called a thread that executes our goroutine. When our goroutine is sleeping, the thread should execute another goroutine. The problem is, which goroutine should it execute next? Well, it should execute goroutines that are not sleeping and ready to be executed. Finding this next goroutine to execute is not easy either. If two goroutines are sleeping at the same time, then our threads might be fighting over the next goroutine that they want to execute. Go needs to protect itself from race conditions as well. On top of that, we need to somehow remember that our current goroutine is sleeping and should be woken up later when the semaphore counter is increased. This makes things quite complicated and takes quite a lot of CPU cycles also. This process of finding the next goroutine to execute, saving the state of the current goroutine, and starting to execute the next goroutine is called context switching.
To avoid the above problem, Go actually uses a hybrid strategy. Go will do the
spin-lock strategy first for a few times. Spin-locking once or twice is cheaper
than making the goroutine sleep because we don’t have to context switch. But the
more you spin, the more you use CPU cycles. There will be a limit where keeping
spinning is not worth it, and you might as well sleep until the one who holds
the lock wakes you up by calling Unlock. So, that’s how the slow-path works,
i.e., it will spin for a few times and sleep if it fails to acquire the lock
after many retries.
The condition where you can’t acquire the mutex lock because it’s being held by
another goroutine is called lock contention. As you see above, higher lock
contention means more CPU cycles wasted for spinning and context switching. If
you take a look at the profiling result below (the same as above), you will see
the runtime.mcall box is quite large.
If you notice, in the flamegraph, runtime.mcall calls runtime.parm_m,
runtime.schedule, runtime.findRunnable, etc. What all these functions do is
perform the context switching we just talked about. runtime.findRunnable is
the function used by Go runtime to find the next runnable goroutine to execute.
Here, you can think a goroutine is “runnable” if it’s not sleeping.
As you can see here, the overhead of the lock contention is quite high. The total CPU time spent in locking, unlocking, and context switching is about 35%.
sync.Map
Identifying the bottleneck of our application is the first step in improving the performance of our app. Knowing the bottleneck helps us find the correct improvements to apply to our application. However, it might not be the whole story. Often, we also need to know the access pattern of our application to choose the right strategy that can improve our application.
Ok, so now we know that we have high lock contention. How do we reduce it? Well,
we can ask ourselves why we need that lock in the first place. We need it to
protect our map from concurrent access. Fortunately, Go has a
sync.Map data structure that we can use. From
the documentation, it says that this particular map is just like map[any]any,
but safe for concurrent access without additional locking or coordination.
Loads, stores, and deletes run in amortized constant time. That sounds like the
map we need. Let’s just swap our map implementation with that.
 1type server struct {
 2    ...
 3    database sync.Map
 4}
 5
 6func (s *server) handleGetCommand(clientId int64, conn io.Writer, command []any) error {
 7    ...
 8    valueObj, ok := s.database.Load(key)
 9    if ok {
10        value := valueObj.(string)
11        ...
12    }
13    ...
14}
15
16func (s *server) handleSetCommand(clientId int64, conn io.Writer, command []any) error {
17    ...
18    s.database.Store(key, value)
19    ...
20}
You can find the full code here.
Let’s run our benchmark again.
1❯ go test . -v -bench=BenchmarkRedisSet -benchmem -benchtime=10s -cpuprofile=cpu.out -run="^$"
2goos: linux
3goarch: amd64
4pkg: github.com/jauhararifin/goredis
5cpu: AMD Ryzen 9 7900X 12-Core Processor
6BenchmarkRedisSet
7BenchmarkRedisSet-24             9882496              1237 ns/op            808707 ops/sec           626 B/op         47 allocs/op
8PASS
9ok      github.com/jauhararifin/goredis 13.738s
Surprisingly, our throughput drops quite a lot now. It drops about 27%. What’s
going on here? Well, before we use sync.Map, we should know its limitations.
From the Go documentation, you can see what the sync.Map is optimized for:
The Map type is optimized for two common use cases: (1) when the entry for a given key is only ever written once but read many times, as in caches that only grow, or (2) when multiple goroutines read, write, and overwrite entries for disjoint sets of keys. In these two cases, use of a Map may significantly reduce lock contention compared to a Go map paired with a separate Mutex or RWMutex.
Those two cases are not the ones we’re currently testing. In our benchmark, each
client generates random keys and calls SET operations using those keys. This
is not case number (1) described by Go documentation above. A single key is not
set once and read many times. Instead, it is set many times. Additionally, each
client can set any key. Each client generates random keys, so keys might
overlap. Two different clients might end up using the same key. This is why
using sync.Map doesn’t give us any improvement. It just adds overhead of using
any instead of string.
However, sync.Map might be more relevant in a real production environment.
Usually, when we have an application, most of the data is never accessed. It
could be that 80% of traffic accesses only 20% of the total data. On top of
that, an entry in the map is rarely changed but often read. Imagine you are
building a social media platform. You can store the user profile in Redis using
a key like this: user/<the_user_id>. If this user is a very popular person,
this entry will be read many times but rarely changed. This entry may change
occasionally when the user updates their profile information, which is rare.
This is why understanding our access pattern is important. Knowing the access pattern helps us find the best strategy to improve the performance of our app.
You might wonder how Go implements data structures like sync.Map. I won’t go
into detail here, but at a high level, Go’s sync.Map combines map, mutex and
atomic operations. If we want to set a key that already exists, we can just swap
the value of the key with the new value. We can use compare-and-swap operation
for this. Remember, compare-and-swap is quite cheap, so it can have better
performance. Because we only access the map using atomic operations, we can just
lock the map using a shared-lock. Now, if the key is not in the map yet, we need
to lock the map exclusively to add that key. By doing this, adding a new key is
quite expensive because we need to acquire the lock exclusively. But, if the key
is already there, we can just lock the map in shared mode and use atomic
operations to swap the value of the key.
Sharding
Ok, it seems sync.Map doesn’t work well in our case. We can try something
else.
The most common trick for performance optimization is to make expensive operations less frequent. I mentioned this in previous section as well. In this case, our expensive operation is the mutex locking. Or to be more precise, our expensive operation comes from the fact that there are a lot of concurrent attempts to lock the mutex that cause a single locking to fall into the slow path more often. Remember how mutex works? If we’re lucky, acquiring the lock from mutex is just as simple as swapping the mutex state from unlocked to locked. Only when the lock is held by another goroutine do we fail to do this and have to pick the slow path, i.e., spinning for a few times and sleeping until woken up when the mutex is unlocked.
So, following the principle of making expensive operations less frequent, we can
try to make it less often for the mutex to pick the slow path. To do this, we
can do sharding. Instead of having one map and one mutex, we can have 1000 maps
and mutexes. We can do this because most of the SET operations are independent
of each other. If we send a SET command for keys a and b, we can perform
the insertion for key a on one map, and insertion for key b on another map.
Now, what we can do is assign each key to one of 1000 maps. For example, key a
goes to map number 12, key b goes to map number 930, key c goes to map
number 8, etc. By doing this, we distribute the load into 1000 maps.
Distributing the load into 1000 maps might not seem to have any benefit. At the end of the day, inserting 1 million keys means locking mutexes 1 million times, and inserting to maps 1 million times as well. But here’s the thing: the chance that there are two concurrent accesses to the same map is smaller now. So, yes, we are going to lock the mutexes 1 million times, but most of those operations will fall into the fast-path because it’s less likely that 2 goroutines lock the same mutex.
As an analogy, imagine a busy 10-lane highway with a single toll gate. If the traffic is low, this is not a problem; when a car arrives at the gate, they can pay quickly and move on. This whole process might finish before the next car arrives at the gate. So, serving a single car is fast because they don’t have to wait for another car. Now, imagine when the traffic is high. Cars arrive at the gate faster than the gate can handle. As a result, there will be a lot of cars waiting for each other. Because of this, now a single car takes longer to serve. To solve this, you can add more gates. You can imagine, instead of having one gate, we can have 15 gates. Now, each car can choose which gate they want, and the load will be distributed to 15 gates instead of one. By doing this, the waiting time for a car will also be reduced.
To implement sharding, first we need a way to choose which shard a key will go
to. The same key has to go into the same shard, because otherwise we can lose
it. If you use map number 412 for key user/1, then you should always use that
same map for key user/1. If you insert the key user/1 to map 412, but fetch
it from map 989, you won’t get the key. So, we need a function that maps a
string to an integer in the range from 0 to 999 that deterministically tells us
which shard should get the key. We can use a
hash function to do this. In
fact, our map actually already does this, that’s why it’s called a
hashmap.
Essentially, a hash function is just a function that takes something and
produces an integer. In our case, the hash function will take a string (our
key) and return an int64. There are a lot of hash functions out there.
Different hash functions are used for different purposes as well. For example,
there are hash functions used for cryptography. Those hash functions are
optimized to be practically collision-free and reasonably fast. In our case, we
want the hash function to be very fast and uniformly distributed. We want our
hash function to be fast because, of course, we want our server to be fast as
well. We don’t want this hash function to become the next bottleneck. We want it
to be uniformly distributed so that each shard has a uniformly distributed load
as well. We don’t want one shard to be the bottleneck. We don’t want one of the
shards to handle 80% of the traffic while the other 999 shards handle 20% of the
traffic.
Fortunately, Go’s standard library provides us with a hash function that is
ready to use. It’s called fnv. There are other hash functions too, and you are
free to explore all the options, but I will use fnv here. We can use the
hash/fnv package to use this hash function:
1const nShard = 1000
2
3func calculateShard(s string) int {
4    hasher := fnv.New64()
5    _, _ = hasher.Write([]byte(s))
6    hash := hasher.Sum64()
7    return int(hash % uint64(nShard))
8}
In the above code, calculateShard is the function that maps our key to the
shard index. Since our hash function returns a 64-bit integer, we need to
convert it so that it ranges from 0 to 999. To do that, we just need to mod the
hash result with the number of shards we have, i.e., 1000.
Now, we need to make 1000 maps and mutexes instead of just one.
1type server struct {
2    ...
3    dbLock   [nShard]sync.RWMutex
4    database [nShard]map[string]string
5}
And don’t forget to update the SET and GET handlers to use the correct
shard.
 1func (s *server) handleGetCommand(clientId int64, conn io.Writer, command []any) error {
 2    ...
 3    shard := calculateShard(key)
 4    s.dbLock[shard].RLock()
 5    value, ok := s.database[shard][key]
 6    s.dbLock[shard].RUnlock()
 7    ...
 8}
 9
10func (s *server) handleSetCommand(clientId int64, conn io.Writer, command []any) error {
11    ...
12    shard := calculateShard(key)
13    s.dbLock[shard].Lock()
14    s.database[shard][key] = value
15    s.dbLock[shard].Unlock()
16    ...
17}
You can find the full source code here.
Let’s run our benchmark again. But, instead of running the benchmark for 10
seconds, I will run it for 20 million SET operations. You can do this by using
-benchtime=20000000x flag instead of -benchtime=10s. The reason for doing
this is because when you set the benchmark time to 10 seconds, Go’s test
framework doesn’t actually run it for 10 seconds; it runs your benchmark several
times first to get a rough estimate of your test’s throughput. From that
estimation, it deduces how many operations it should run to make the test last
10 seconds. The problem is, sometimes our throughput is higher in the beginning
but slowly drops as the program runs. Because of this, Go will incorrectly
estimate the number of operations needed to last 10 seconds. I set the benchmark
to run exactly 20 million operations to avoid this problem. You might wonder why
our program has higher throughput during startup but slowly drops. There might
be a reason for that, but it would take quite a long time to explain in this
article, so I won’t be covering that. Ok, let’s run our benchmark.
1❯ go test . -v -bench=BenchmarkRedisSet -benchmem -benchtime=20000000x -cpuprofile=cpu.out -run="^$"
2goos: linux
3goarch: amd64
4pkg: github.com/jauhararifin/goredis
5cpu: AMD Ryzen 9 7900X 12-Core Processor
6BenchmarkRedisSet
7BenchmarkRedisSet-24            20000000               179.2 ns/op         5581010 ops/sec           580 B/op         42 allocs/op
8PASS
9ok      github.com/jauhararifin/goredis 3.926s
Wow, the throughput increased more than 5x 🤯. That is quite some improvement,
isn’t it? Now, if you open the CPU profiling result on speedscope, you won’t see
big boxes of runtime.mcall, sync.(*RWMutex).Lock, sync.(*RWMutex).Unlock
anymore.
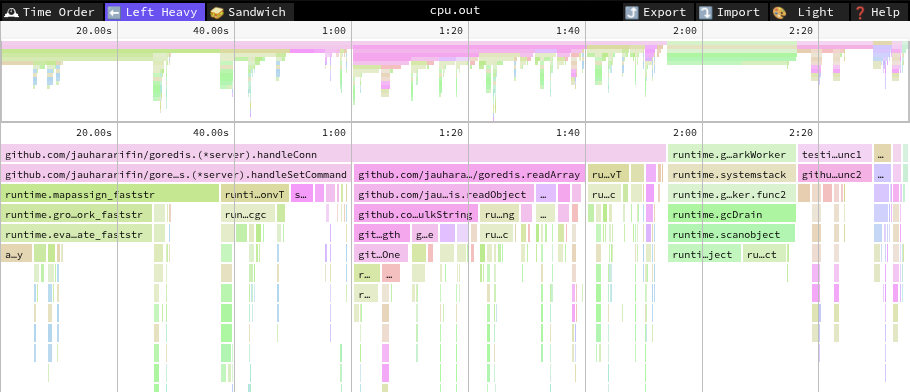
Runtime Functions
If you take a look at the profiling result, now there are only two topmost boxes
with significant size, i.e., handleConn and runtime.gcBgMarkWorker. We know
handleConn is our handler and its bottleneck is the handleSetCommand. If you
look closely at the handleSetCommand, you can see that now the biggest
bottleneck is not the Lock and Unlock anymore, but the
runtime.mapassign_faststr.
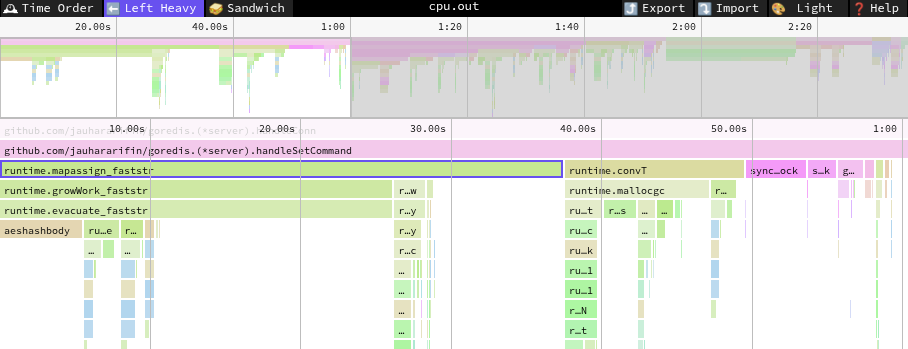
If you look closely again, you will see that the second bottleneck of
handleSetCommand is runtime.convT, which calls runtime.mallocgc. So, now
we have 3 candidate bottlenecks we can analyze, i.e.,
runtime.mapassign_faststr, runtime.convT, and runtime.gcBgMarkWorker. What
are these things?
mapassign_faststr
Let’s start with runtime.mapassign_faststr. What is this? We never write any
function that resembles this name. Where does this function come from? Well,
this function is provided by Golang’s runtime, that’s why it starts with the
runtime package. You can think of a function that is placed in the runtime
package as a function provided by Golang’s runtime. So, what does this function
do? Well, from its name, we can actually tell that it assigns a value to a map.
When you assign a value to a map, behind the scenes, the Go compiler will
rewrite your code to call runtime.mapassign_faststr. If your map’s key is
string, it has a special case and uses mapassign_faststr. It has other
functions that can be used for other types like a struct as well. So, the
profiling result tells us that the next potential bottleneck is assigning a
value to a map.
Now, you might wonder, how do I know all these things? Well, you can actually
experiment with it yourself. Try to write code that inserts a key to a map of
string, and debug it. Run the code line by line using the debugger and see
which function is called when you insert a value to a map. Let’s try that.
First, let’s write a main function that inserts a value to a map.
1package main
2
3func main() {
4    m := make(map[string]int)
5    m["hello"] = 10
6    println(m["hello"])
7}
Now, we can save it as map.go, build it to map, and use delve to debug our
application. If you don’t have delve yet, you can follow their
installation guide.
1❯ go build -o map map.go
2❯ dlv exec ./map
3Type 'help' for list of commands.
4(dlv)
You can type help to get the list of instructions to operate the debugger. One
of the most useful things to do in a debugger is adding breakpoints. To add a
breakpoint in your program, use break <the_function_name>. We can use
break main.main to add a breakpoint to our main function. When we add a
breakpoint to a function, our debugger will stop when we execute that function.
So, later when we run the program inside the debugger, we will be stopped at
main.main. You may ask why we need to do this? main is the first function we
call, why do we need to pause it there? Why can’t the debugger be smart enough
to know that I want to run the program line by line? Well, the thing is, main
is actually not the first function run when you start your program. There are a
bunch of setup steps before the main function is run. Go runtime needs to set up
the stack, garbage collection, etc. And also, most of the time, a program is
very complex and we don’t want to break on the main function. Most of the
time, when we debug a specific function, we want to break at that particular
function.
Ok, now let’s run our program. We can type continue to start running the
program inside the debugger.
 1❯ dlv exec ./map
 2Type 'help' for list of commands.
 3(dlv) break main.main
 4Breakpoint 1 set at 0x457676 for main.main() ./map.go:3
 5(dlv) continue
 6> main.main() ./map.go:3 (hits goroutine(1):1 total:1) (PC: 0x457676)
 7Warning: debugging optimized function
 8     1: package main
 9     2:
10=>   3: func main() {
11     4:         m := make(map[string]int)
12     5:         m["hello"] = 10
13     6:         println(m["hello"])
14     7: }
15     8:
As you can see, now the program is paused at main.main. Next, we can type
step twice so that we are about to execute m["hello"] = 10.
 1(dlv) c
 2> main.main() ./map.go:3 (hits goroutine(1):1 total:1) (PC: 0x457676)
 3Warning: debugging optimized function
 4     1: package main
 5     2:
 6=>   3: func main() {
 7     4:         m := make(map[string]int)
 8     5:         m["hello"] = 10
 9     6:         println(m["hello"])
10     7: }
11     8:
12(dlv) step
13> main.main() ./map.go:4 (PC: 0x45767d)
14Warning: debugging optimized function
15     1: package main
16     2:
17     3: func main() {
18=>   4:         m := make(map[string]int)
19     5:         m["hello"] = 10
20     6:         println(m["hello"])
21     7: }
22     8:
23(dlv) step
24> main.main() ./map.go:5 (PC: 0x4576c9)
25Warning: debugging optimized function
26     1: package main
27     2:
28     3: func main() {
29     4:         m := make(map[string]int)
30=>   5:         m["hello"] = 10
31     6:         println(m["hello"])
32     7: }
33     8:
Now, here is the tricky part. If you use step, delve will skip builtin
functions like runtime.mapassign_faststr. We need to use step-instruction to
step one instruction instead of one logical Golang source code line.
 1(dlv) step
 2> main.main() ./map.go:5 (PC: 0x4576c9)
 3Warning: debugging optimized function
 4     1: package main
 5     2:
 6     3: func main() {
 7     4:         m := make(map[string]int)
 8=>   5:         m["hello"] = 10
 9     6:         println(m["hello"])
10     7: }
11     8:
12(dlv) step-instruction
13> main.main() ./map.go:5 (PC: 0x4576d0)
14Warning: debugging optimized function
15        map.go:4        0x4576b8        4889442438      mov qword ptr [rsp+0x38], rax
16        map.go:4        0x4576bd        0f1f00          nop dword ptr [rax], eax
17        map.go:4        0x4576c0        e89be9feff      call $runtime.fastrand
18        map.go:4        0x4576c5        89442434        mov dword ptr [rsp+0x34], eax
19        map.go:5        0x4576c9        488d05f06c0000  lea rax, ptr [rip+0x6cf0]
20=>      map.go:5        0x4576d0        488d5c2428      lea rbx, ptr [rsp+0x28]
21        map.go:5        0x4576d5        488d0debef0000  lea rcx, ptr [rip+0xefeb]
22        map.go:5        0x4576dc        bf05000000      mov edi, 0x5
23        map.go:5        0x4576e1        e8ba5efbff      call $runtime.mapassign_faststr
24        map.go:5        0x4576e6        48c7000a000000  mov qword ptr [rax], 0xa
25        map.go:6        0x4576ed        488d05cc6c0000  lea rax, ptr [rip+0x6ccc]
Now, instead of Golang’s code, you see a bunch of assembly code. This is because
we chose to step one instruction instead of one line. If you look at 3 lines
below the current instruction, you will see an instruction that looks like this:
call $runtime.mapassign_faststr. This assembly instruction basically tells us
to call a function called runtime.mapassign_faststr. That’s how we know that
inserting a string to a map will call runtime.mapassign_faststr.
You can think of assembly code as the actual code that will be executed by your CPU. CPUs don’t understand our Go code; they only understand machine instructions. Machine instructions are very tedious to write manually because of several reasons. Different CPUs might have different kinds of instructions. And a single machine instruction is usually very primitive. It doesn’t have high-level concepts like loops and variables. It is the job of the Go compiler to translate our Go code into machine instructions. You can learn more about x86 assembly here.
With a similar technique, you can also see that fetching the value from a map of
string will call runtime.mapaccess1_faststr.
 1> main.main() ./map.go:6 (PC: 0x4576ed)
 2Warning: debugging optimized function
 3     1: package main
 4     2:
 5     3: func main() {
 6     4:         m := make(map[string]int)
 7     5:         m["hello"] = 10
 8=>   6:         println(m["hello"])
 9     7: }
10     8:
11(dlv) si
12> main.main() ./map.go:6 (PC: 0x4576f4)
13Warning: debugging optimized function
14        map.go:5        0x4576d5        488d0debef0000  lea rcx, ptr [rip+0xefeb]
15        map.go:5        0x4576dc        bf05000000      mov edi, 0x5
16        map.go:5        0x4576e1        e8ba5efbff      call $runtime.mapassign_faststr
17        map.go:5        0x4576e6        48c7000a000000  mov qword ptr [rax], 0xa
18        map.go:6        0x4576ed        488d05cc6c0000  lea rax, ptr [rip+0x6ccc]
19=>      map.go:6        0x4576f4        488d5c2428      lea rbx, ptr [rsp+0x28]
20        map.go:6        0x4576f9        488d0dc7ef0000  lea rcx, ptr [rip+0xefc7]
21        map.go:6        0x457700        bf05000000      mov edi, 0x5
22        map.go:6        0x457705        e8d65afbff      call $runtime.mapaccess1_faststr
23        map.go:6        0x45770a        488b00          mov rax, qword ptr [rax]
24        map.go:6        0x45770d        4889442420      mov qword ptr [rsp+0x20], rax
You can continue experimenting with it. Try to see which runtime function is called when you create a slice, append to a slice, send to a channel, etc.
Memory Allocations
Now, let’s talk about runtime.convT. From the profiling result, we know
handleSetCommand calls runtime.convT somewhere and it takes a lot of our CPU
time. You can follow the method I used in the
previous section to know which part actually calls
runtime.convT. However, it’s quite tedious to actually run the server, trigger
the SET command, and step the code line-by-line until the runtime.convT is
called. To save more time, I’ll show you another way to find which line triggers
runtime.convT. First, you can build your project and open it with delve.
1❯ go build -o server goredis/main.go
2❯ dlv exec server
3Type 'help' for list of commands.
4(dlv)
But now, instead of setting a breakpoint and running it, we can just disassemble
the code. To do that, we can use the disassemble command. We want to
disassemble the handleSetCommand function in the goredis package. To do
that, we can type disassemble -l goredis.handleSetCommand.
 1TEXT github.com/jauhararifin/goredis.(*server).handleSetCommand(SB) /home/jauhararifin/Repositories/goredis/server.go
 2        server.go:244   0x4f4620        4c8da42450ffffff                lea r12, ptr [rsp+0xffffff50]
 3        server.go:244   0x4f4628        4d3b6610                        cmp r12, qword ptr [r14+0x10]
 4        server.go:244   0x4f462c        0f86e0040000                    jbe 0x4f4b12
 5        server.go:244   0x4f4632        55                              push rbp
 6        server.go:244   0x4f4633        4889e5                          mov rbp, rsp
 7        server.go:244   0x4f4636        4881ec28010000                  sub rsp, 0x128
 8        server.go:244   0x4f463d        4889b42458010000                mov qword ptr [rsp+0x158], rsi
 9        server.go:244   0x4f4645        48898c2448010000                mov qword ptr [rsp+0x148], rcx
10        server.go:244   0x4f464d        4889bc2450010000                mov qword ptr [rsp+0x150], rdi
11...
There are a bunch of assembly codes there. You can type /convT to search any
occurrence of convT text in the assembly code.
1        server.go:264   0x4f4800        e81b73f1ff                      call $runtime.convT
2        ...
3        server.go:265   0x4f4827        e8f472f1ff                      call $runtime.convT
4        ...
5        server.go:266   0x4f484e        e8cd72f1ff                      call $runtime.convT
As you can see, it shows where the runtime.convT is called. We know it’s
called at
server.go:264.
Those lines are:
262s.logger.Debug(
263    "SET key into value",
264    slog.String("key", key),
265    slog.String("value", value),
266    slog.Int64("clientId", clientId),
267)
If you look at the function signature of Debug, it looks like this:
1func (l *Logger) Debug(msg string, args ...any)
Which indicates that the Debug function is expecting any, but slog.String
returns slog.Attr. runtime.convT is called when you need to convert a type
to an interface.
Now, that’s actually not the most important part. If you look at the profiling
result, you’ll see that most of the runtime.convT CPU is used to call
runtime.mallocgc. What is this runtime.mallocgc?
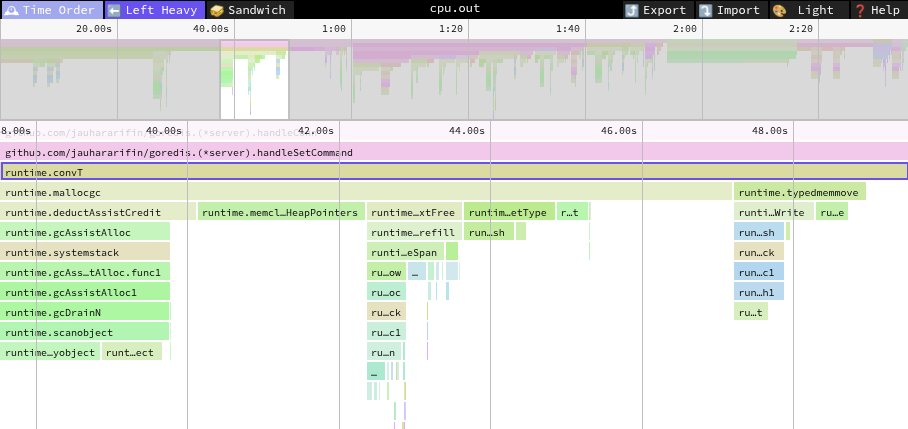
runtime.mallocgc is just like another internal runtime function used by the
Golang runtime. From the name, it’s actually very clear what it does: it
allocates memory. Just like
malloc in C. The difference
is that the allocated object lifetime is managed by the Golang runtime as well.
So, you don’t have to free the allocated memory once you’ve done using it.
Golang’s runtime garbage collector will deallocate those objects for you.
In this article, I’ll assume that you already know what memory is and how our variables are stored in memory.
Now, the thing is, converting a concrete type to an interface will most likely
allocate an object. You can think of an interface in Go as a struct containing a
pointer to the real object and a bunch of function pointers. Let me give you an
example. You know that bufio.Reader implements the io.Reader interface. You
can think of an io.Reader interface, behind the scenes, as just a struct that
looks like this:
1package io
2
3type ReaderInterface struct {
4    theObject uintptr
5
6    Read func(theObject uintptr, buff []byte) (n int, err error)
7}
And bufio.Reader is just an ordinary struct:
1package bufio
2
3type Reader struct{...}
4
5func (*Reader) Read(buff []byte) (n int, err error) { ... }
But behind the scenes, you can think of bufio.Reader as something that looks
like this:
1package bufio
2
3type Reader struct{...}
4
5// the Read method is just a function that takes `bufio.Reader` as its first parameter.
6func Reader_Read(theObject uintptr, buff []byte) (n int, err error) { ... }
When you call the Read method, what happens behind the scenes is something
like this:
1// originally, calling Read method is written like this
2r := bufio.Reader{...}
3r.Read(...)
4
5// but, you can think, internally, it looks like this
6r := bufio.Reader{...}
7Reader_Read(&r, ...) // calling a method is just calling a function
8                     // and passing the object as its first argument
Normally, you can convert a bufio.Reader to io.Reader by doing this:
1r := bufio.Reader{...}
2var s io.Reader = r
But you can think that behind the scenes, what happens is something like this:
1r := bufio.Reader{...}
2var s io.ReaderInterface = io.ReaderInterface {
3    theObject: &r,
4    Read: bufio.Reader_Read,
5}
I need to note here that this is not exactly what actually happens. This is more
like an analogy. The point is that an interface is just another data structure
that contains information about the underlying value and the list of methods it
has (it’s called the
vtable). And a method is
just an ordinary function where the first parameter is the object it operates
on. If you notice, in my analogy, I convert the Read method of Reader struct
into Reader_Read. This is called
name mangling, and it’s actually
more complicated than that. All functions and methods are actually just
functions with mangled names. So a method w of type x in package y/z will
be mangled into a function called y/z.(x).w, for example. The mangling rule of
Go is not really standardized yet, so we can’t really rely on that.
Now, because an interface needs a pointer to its underlying type, it means the
underlying type must be moved into the heap. Well, not always, but most of the
time. That’s why converting a struct to an interface might call mallocgc. The
Go compiler actually has a technique called
escape analysis to remove the
heap allocation if possible. In our case, the Go compiler can’t be sure that
it’s safe to remove the heap allocation when we pass slog.Attr to Debug, so
the runtime.mallocgc is still there.
Allocating memory is actually quite a complex task. There are a bunch of
libraries and algorithms that try to do it. Go uses an algorithm similar to
TCMalloc. You
can read the implementation of mallocgc in
malloc.go. There is a comment
explaining that the algorithm was based on tcmalloc.
1// Memory allocator.
2//
3// This was originally based on tcmalloc, but has diverged quite a bit.
4// http://goog-perftools.sourceforge.net/doc/tcmalloc.html
The allocation algorithm is quite complex because you need to consider the fact that there can be multiple goroutines trying to allocate objects concurrently. The objects you want to allocate have different sizes as well. Because of that, you can have memory fragmentation that can slow down your application. That’s why it’s best not to allocate too much. It’s better to allocate large long-living objects once in a while, compared to allocating small short-living objects very often.
Garbage Collection
Now, let’s talk about runtime.gcBgMarkWorker. Well, this is the Go garbage
collection process. Go uses a generational garbage collection technique. The way
it works is, first it will try to mark all objects that are reachable from our
variables as “live” objects. Whichever objects that are not “live” are
considered dead and should be deallocated. This phase is called the mark phase.
The second phase is freeing all of the dead objects. This phase is called the
sweep phase. That’s why the algorithm is called mark and sweep. From the name,
we can assume runtime.gcBgMarkWorker is the function that runs the first phase
(the mark phase). You can also read the source code to be sure:
 1func init() {
 2    go forcegchelper()
 3}
 4
 5func forcegchelper() {
 6    ...
 7    gcStart(...)
 8    ...
 9}
10
11func gcStart(trigger gcTrigger) {
12    ...
13    gcBgMarkStartWorkers()
14    ...
15}
16
17// gcBgMarkStartWorkers prepares background mark worker goroutines. These
18// goroutines will not run until the mark phase, but they must be started while
19// the work is not stopped and from a regular G stack. The caller must hold
20// worldsema.
21func gcBgMarkStartWorkers() {
22    // Background marking is performed by per-P G's. Ensure that each P has
23    // a background GC G.
24    //
25    // Worker Gs don't exit if gomaxprocs is reduced. If it is raised
26    // again, we can reuse the old workers; no need to create new workers.
27    for gcBgMarkWorkerCount < gomaxprocs {
28        go gcBgMarkWorker()
29        ...
30    }
31    ...
32}
As you can see, when your Go program starts, it spawns some threads to run
gcBgMarkWorker that run the mark phase. I’m actually not really sure whether
this gcBgMarkWorker is run inside a goroutine or not; I might need to read
more about the internal garbage collection logic.
So, the way it works is, when your memory allocation reaches a certain
threshold, Go garbage collection will be triggered. And what this means is that
the more often you allocate, the more often the GC (garbage collector) runs. So,
the fact that runtime.mallocgc is one of our bottlenecks means we allocate a
lot and it affects the GC as well. That’s why, usually, when your CPU spends a
lot of time on runtime.mallocgc, it will also spend a lot of time on
runtime.gcBgMarkWorker.
For a more detailed guide on the Go Garbage Collector, you can read A Guide to the Go Garbage Collector
Reducing Allocations
Let’s try to reduce our allocations. By reducing the allocations, we should
reduce the CPU time spent on runtime.mallocgc, which also will reduce the CPU
time spent on runtime.gcBgMarkWorker. But before that, let me bring the last
benchmark result.
1❯ go test . -v -bench=BenchmarkRedisSet -benchmem -benchtime=20000000x -cpuprofile=cpu.out -run="^$"
2goos: linux
3goarch: amd64
4pkg: github.com/jauhararifin/goredis
5cpu: AMD Ryzen 9 7900X 12-Core Processor
6BenchmarkRedisSet
7BenchmarkRedisSet-24            20000000               179.2 ns/op         5581010 ops/sec           580 B/op         42 allocs/op
8PASS
9ok      github.com/jauhararifin/goredis 3.926s
Notice that since we added -benchmem flag, the benchmark result is not only
reporting the latency and throughput, it also reports the number of bytes
allocated per operation and the number of allocations per operation. We can see
that we only allocate 580 bytes per operation and we make 42 allocations per
operation. Later, we can use these numbers to confirm that our improvement
indeed reduces the number of allocations. We will only focus on the number of
allocations per operation. We won’t be analyzing the number of bytes allocated
per operation since it’s already quite small. Usually, when the size of
allocations is this small, it doesn’t matter that much compared to the number of
allocations.
In the previous section, we’ve established that the
runtime.mallocgc comes from the Debug function that we use to print debug
logs. Let’s just try to remove that debug log.
 1func (s *server) handleConn(clientId int64, conn net.Conn) {
 2    ...
 3-   s.logger.Debug(
 4-       "request received",
 5-       slog.Any("request", request),
 6-       slog.Int64("clientId", clientId),
 7-   )
 8    ...
 9}
10
11func (s *server) handleGetCommand(clientId int64, conn io.Writer, command []any) error {
12    ...
13-   s.logger.Debug("GET key", slog.String("key", key), slog.Int64("clientId", clientId))
14    ...
15}
16
17func (s *server) handleSetCommand(conn io.Writer, command []any) error {
18    ...
19-   s.logger.Debug(
20-       "SET key into value",
21-       slog.String("key", key),
22-       slog.String("value", value),
23-       slog.Int64("clientId", clientId),
24-   )
25    ...
26}
Let’s try benchmarking our code again:
1❯ go test . -v -bench=BenchmarkRedisSet -benchmem -benchtime=20000000x -cpuprofile=cpu.out -run="^$"
2goos: linux
3goarch: amd64
4pkg: github.com/jauhararifin/goredis
5cpu: AMD Ryzen 9 7900X 12-Core Processor
6BenchmarkRedisSet
7BenchmarkRedisSet-24            20000000               139.0 ns/op         7192789 ops/sec           316 B/op         36 allocs/op
8PASS
9ok      github.com/jauhararifin/goredis 3.075s
Nice, now we only have 36 allocations per ops. We’ve removed about 6 allocations
per operation. I’m not sure why we removed 6 allocations, to be honest. In my
calculation, we’ve removed 2 debug logs on the SET operation’s path. Those 2
debug logs should correspond to 5 allocations. I’m not sure yet where the
additional one allocation comes from.
Now, let’s try to reduce the allocations further. Let’s open the profiling
result again. This time, let’s look into the “Sandwich” tab, and look for
runtime.mallocgc. Using the sandwich tab, you can see all the call stacks of
runtime.mallocgc to determine who calls runtime.mallocgc and what functions
are called by runtime.mallocgc.
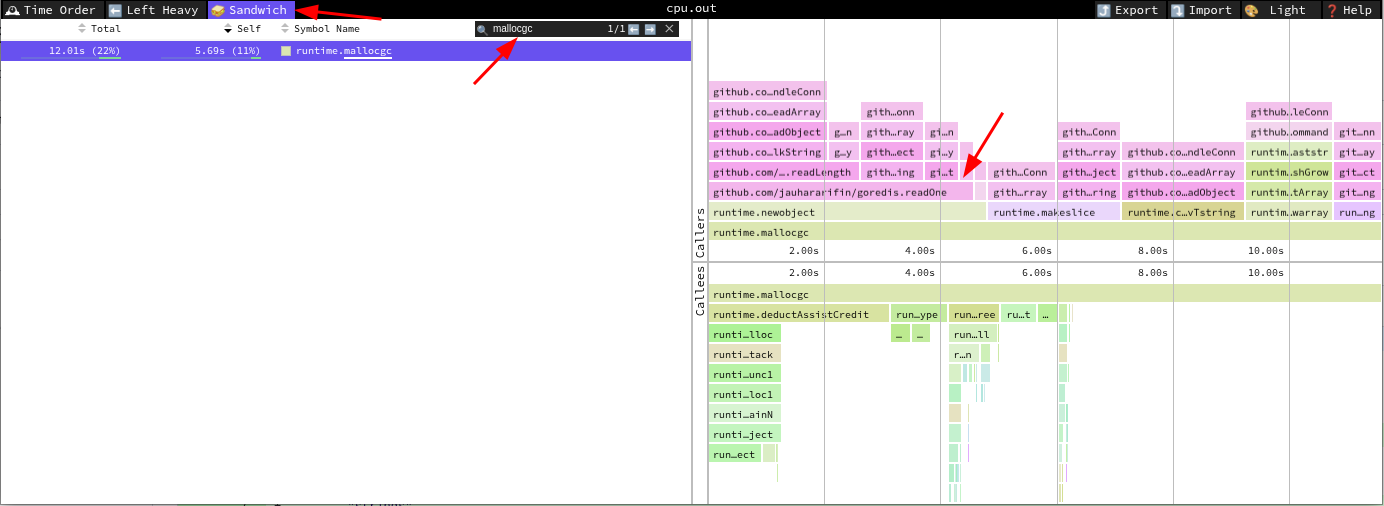
The flamegraph shows that the function readOne calls runtime.mallocgc. Which
makes sense because if you look into that function, we allocate a slice of bytes
with the size of one.
 1func readOne(r io.Reader) (byte, error) {
 2    buff := [1]byte{}
 3    n, err := r.Read(buff[:])
 4    if err != nil {
 5        return 0, err
 6    }
 7    if n != 1 {
 8        return 0, io.EOF
 9    }
10    return buff[0], nil
11}
We can actually use the Go compiler to find out where the allocations are
performed in our code. We can use go build command and pass -gcflags "-m -l"
to output the memory analysis.
 1❯ go build -gcflags "-l -m" *.go
 2# command-line-arguments
 3./buff_writer.go:17:22: leaking param: w
 4./buff_writer.go:18:23: &sync.Mutex{} escapes to heap
 5./buff_writer.go:19:9: &bufferWriter{...} escapes to heap
 6./buff_writer.go:22:13: make([]byte, 4096) escapes to heap
 7./buff_writer.go:91:7: leaking param content: b
 8./buff_writer.go:28:7: leaking param content: b
 9./buff_writer.go:59:7: leaking param content: b
10./buff_writer.go:59:30: leaking param: buff
11./resp.go:82:14: leaking param: r
12./resp.go:83:2: moved to heap: buff
13./resp.go:94:17: leaking param: r
14...
15./resp.go:48:24: ... argument does not escape
16./resp.go:48:79: b escapes to heap
17./resp.go:51:16: string(buff) escapes to heap
18...
There is one line saying ./resp.go:83:2: moved to heap: buff. This line tells
us that our variable buff has escaped to heap and needs an allocation each
time we call readOne. You can use this information to find out where your
allocations are and remove them.
It is very unfortunate that the buff in readOne needs an allocation. The
reason it allocates memory in the heap is that we want to call Read that
accepts a slice instead of a single byte. We don’t really want to read a slice
of bytes. It just happens that the API requires a slice instead of a single
byte.
On top of that, in function readBulkString, we allocate another slice of bytes
to read the raw string as bytes and convert it to string before return. As you
can see in the above analysis, the line
./resp.go:51:16: string(buff) escapes to heap tells us that converting
[]byte to string triggers another allocation.
 1func readBulkString(r io.Reader) (string, error) {
 2    ...
 3    buff := make([]byte, size)
 4    if _, err := io.ReadFull(r, buff); err != nil {
 5        return "", err
 6    }
 7    ...
 8
 9    // the line below triggers another allocation
10    return string(buff), nil
11}
To eliminate those allocations, we can use some kind of global variable to store
the []byte we are going to use for reading inputs from client. Now, instead of
allocating a new []byte each time we read the user input, we can just allocate
it once and reuse it each time we read the input. We can do this because the
[]byte is just a temporary buffer. In the readOne function, the []byte is
no longer used after return. In the readBulkString function, the []byte will
be converted into string and will no longer be used. However, we can’t just
make it a global variable because multiple clients can read the input
concurrently. So, instead, we are going to have a buffer for each client.
Now, let’s refactor the resp.go. First, we can create a new struct called
messageReader that will handle all the input reader. This struct will be
created one for each client. This is where we put our buffer.
 1type messageReader struct {
 2    r             *bufio.Reader
 3    temp          []byte
 4    stringBuilder strings.Builder
 5}
 6
 7func newMessageReader(r io.Reader) *messageReader {
 8    return &messageReader{
 9        r:             bufio.NewReader(r),
10        temp:          make([]byte, 4096),
11        stringBuilder: strings.Builder{},
12    }
13}
Instead of purely using []byte, I will also use strings.Builder here to let
you know that such a thing exists. strings.Builder is a convenient helper to
build a string without allocating a new string each time we append to it.
Internally, strings.Builder uses []byte to store the temporary string. We
can call the String() method to convert those bytes into a string.
Next, let’s implement the ReadString method to read a string from the input.
 1func (m *messageReader) ReadString() (string, error) {
 2    b, _ := m.r.ReadByte()
 3    if b == '$' {
 4        length, _ := m.readValueLength()
 5
 6        // Reset resets the strings.Builder. We do this so that the old data
 7        // won't affect our new string
 8        m.stringBuilder.Reset()
 9
10        // If we know that the string we're going to receive will be of a
11        // certain length, we can force the strings.Builder to pre-allocate
12        // a buffer with our known length.
13        m.stringBuilder.Grow(length)
14        if err := m.pipeToWriter(&m.stringBuilder, length); err != nil {
15            return "", err
16        }
17
18        // This is how we build the string without additional allocation
19        s := m.stringBuilder.String()
20        if err := m.skipCRLF(); err != nil {
21            return "", err
22        }
23
24        return s, nil
25    } else {
26        return "", fmt.Errorf("malformed input")
27    }
28}
29
30func (m *messageReader) readValueLength() (int, error) {
31    b, _ := m.r.ReadByte()
32    result := int(b - '0')
33
34    for b != '\r' {
35        b, err = m.r.ReadByte()
36        if b != '\r' {
37            result = result*10 + int(b-'0')
38        }
39    }
40
41    b, _ = m.r.ReadByte()
42    if b != '\n' {
43        return 0, fmt.Errorf("malformed input")
44    }
45
46    return result, nil
47}
48
49func (m *messageReader) pipeToWriter(w io.Writer, length int) error {
50    remaining := length
51    for remaining > 0 {
52        n := remaining
53        if n > len(m.temp) {
54            n = len(m.temp)
55        }
56        io.ReadFull(m.r, m.temp[:n])
57        remaining -= n
58        w.Write(m.temp[:n])
59    }
60
61    return nil
62}
I omit a lot of error handling to make the code more concise.
Writing the rest of the functionality of messageReader is quite
straightforward. You can check
this commit
to see the full implementation.
Next, we need to wire the messageReader to our handler:
 1func (s *server) handleConn(clientId int64, conn net.Conn) {
 2    ...
 3-   reader := bufio.NewReader(conn)
 4+   reader := newMessageReader(conn)
 5    ...
 6    for {
 7-       request, err := readArray(reader, true)
 8+       length, err := reader.ReadArrayLen()
 9        ...
10-       commandName, ok := request[0].(string)
11+       commandName, err := reader.ReadString()
12+       unsafeToUpper(commandName)
13        ...
14
15        switch commandName {
16        case "GET":
17-           err = s.handleGetCommand(writer, request)
18+           err = s.handleGetCommand(reader, writer)
19        case "SET":
20-           err = s.handleSetCommand(writer, request)
21+           err = s.handleSetCommand(reader, writer)
22        ...
23        }
24
25    }
26}
27
28func (s *server) handleGetCommand(reader *messageReader, conn io.Writer) error {
29-   ...
30+   key, err := reader.ReadString()
31    ...
32}
33
34func (s *server) handleSetCommand(reader *messageReader, conn io.Writer) error {
35-   ...
36+   key, err := reader.ReadString()
37-   ...
38+   value, err := reader.ReadString()
39    ...
40}
You may notice a new function called unsafeToUpper. This function is used to
convert a string to uppercase. It’s similar to strings.ToUpper, but instead of
returning a new string, unsafeToUpper converts the passed string directly.
This function is unsafe because, in Go, strings are supposed to be immutable.
But, here, we mutate it. We can do this using the unsafe package provided by
Go. Using unsafe.StringData, we can get the pointer to the raw bytes of the
string. Then, we can use unsafe.Slice to convert the pointer to the raw bytes
into []byte. Then, we just iterate through the bytes and convert every
lowercase byte into uppercase.
 1func unsafeToUpper(s string) {
 2    bytes := unsafe.Slice(unsafe.StringData(s), len(s))
 3    for i := 0; i < len(bytes); i++ {
 4        b := bytes[i]
 5        if b >= 'a' && b <= 'z' {
 6            b = b + 'A' - 'a'
 7            bytes[i] = b
 8        }
 9    }
10}
Ok, that’s quite some changes. Let’s run the benchmark again.
1❯ go test . -v -bench=BenchmarkRedisSet -benchmem -benchtime=20000000x -cpuprofile=cpu.out -run="^$"
2goos: linux
3goarch: amd64
4pkg: github.com/jauhararifin/goredis
5cpu: AMD Ryzen 9 7900X 12-Core Processor
6BenchmarkRedisSet
7BenchmarkRedisSet-24            20000000                99.89 ns/op       10011157 ops/sec           164 B/op          4 allocs/op
8PASS
9ok      github.com/jauhararifin/goredis 2.245s
Wow, look at that, now we only have 4 allocations per operation, and we have 10
million operations per second throughput. That is impressive, isn’t it? Now, if
you look at the profiling result again, you won’t see any runtime.mallocgc
anymore because we’ve reduced to only 4 allocations per operation. We still have
runtime.gcBgMarkWorker, though. But, it’s not as bad as before. I think we can
reduce the allocations to zero allocation per ops, but it would be quite complex
to explain here.
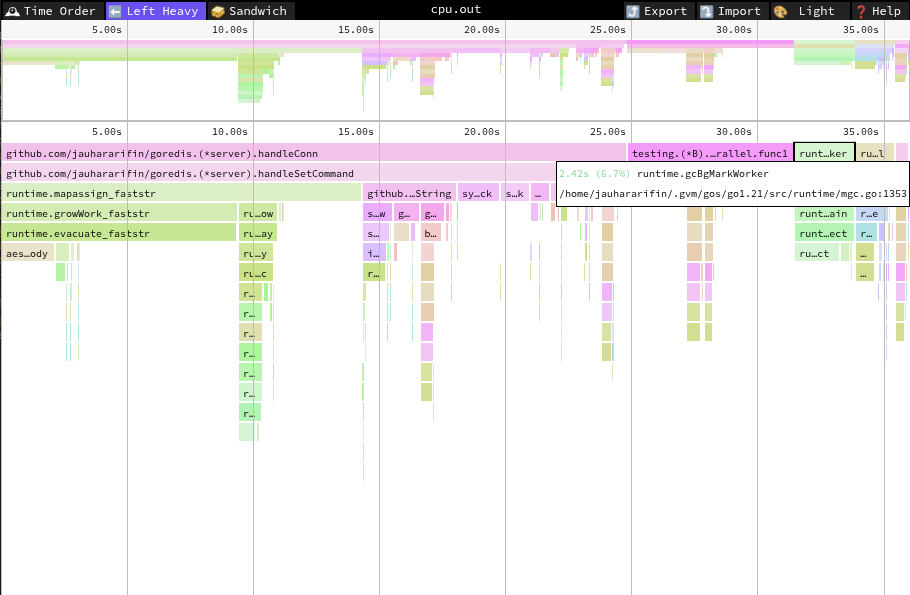
Swisstable
So far, this article uses Go 1.21 where the map is not implemented using swisstable. In Go 1.24, map will be implemented using swisstable.
From the profiling result, it’s quite clear that our next bottleneck is
runtime.mapassign_faststr. To improve our map operation, clearly, we can just
use a faster map. But, before that, let’s talk about how map works internally.
In Go, and other programming languages as well, maps are usually implemented
using hash table data structure.
Internally, a hash table is just an array. When you insert a key xyz to a map,
there is an algorithm inside the map implementation to decide which index this
key should be put on. That algorithm uses a
hash function to convert xyz
into an integer and use it to determine the index where xyz should be put
into.

What happens if two different keys have the same hash value? This condition is called collision. When there are two different keys, but they have the same hash value, we say that those keys collide. There are two major techniques to solve collision, i.e., chaining and open addressing. Up until version 1.23, Go uses chaining to solve the collision. In chaining, each element in the array is actually a linked list. So, when two keys collide, both of them will be inserted into the same list in linear fashion.

Because of this, the more collisions you have, the slower your operation will be.
Ideally, you want a hash function that has a low collision rate. There are a
bunch of hash functions out there such as
MurmurHash and
xxHash. In the
previous section, we also used a hash function called fnv
provided by the Go standard library. Those hash functions have good enough
collision rates.
There are other hash functions that are used in cryptography like MD5, and SHA1. Cryptographic hash functions typically have very small collision rates, but they are very slow. We want our hash function to be super fast because we are going to call it millions of times. Each time we insert a key to a map, or fetch a key from the map, we need to hash them first. Cryptographic hash functions are not suitable for our purposes because even though they’re designed to have extremely low collision rates, they are very slow. It’s ok for them to be a little slower in favor of smaller collision rates. In contrast, for us, it’s ok to have higher collision rates in favor of computation speed.
Choosing a good hash function is not enough. The more keys you insert into the hash table, the more likely they are to collide with each other. If you represent the hash table using an array of 100 elements, no matter how good your hash function is, you will always have collisions when you have 101 unique keys.
To reduce the collision rate, typically, a hash table is designed so that it can grow when the number of elements gets bigger. In Go, when the ratio between the number of entries in the map vs the size of the internal array reaches a certain threshold, the map will grow twice as large. By doing this, the collision rate can be maintained at a low level.
The problem with the chaining method is it’s not cache friendly when a collision occurs. When your key collides, you need to iterate through a linked list, which means you will access objects that are placed far from each other in the memory. This is where open addressing can perform better than chaining.
In open addressing, when a collision occurs, instead of iterating through a linked list, we just insert the key into the next index. This is called probing.

By doing this, when a collision occurs, we just need to check the next slot. Checking the next slot is cheaper than iterating through a linked list because there is a high chance that the next slot element is in the same cache line as the original slot.
Of course, the next slot might already be occupied by another key. In this case, you need to check the next-next slot. This goes on until you find one empty slot. This is called linear probing. There are other probing techniques, one of them is quadratic probing, which found to be better at handling collision, but I won’t go into much detail on the probing technique.
We can improve the probing performance by using SIMD. Modern CPUs typically have SIMD instructions. With SIMD instructions, we can perform one instruction on multiple data. We can utilize these instructions for probing. We can check the value of the current index and next few indexes using one instruction. Open addressing allows us to do this because of the way it handles collision. We can’t easily utilize SIMD in chaining-based hash tables.
There is a version of hash table called Swisstable that uses open addressing and utilizes SIMD instructions. There is also a library we can use that already implements it in Go called SwissMap. The Go team also plans to use swisstable for their map in Go 1.24.
As of now, Go doesn’t support any SIMD operations yet. So, to use SIMD, you need to manually write assembly code.
Let’s try to replace our map with the swisstable version. I will copy the implementation of SwissMap and modify it a little bit to match our needs. Their implementation uses generics to allow any key and value type. But, as of Go 1.21, using generics has its own performance overhead.
 1type server struct {
 2-   database [nShard]map[string]string
 3+   database [nShard]*swisstable.Map
 4}
 5
 6func (s *server) handleGetCommand(reader *messageReader, conn io.Writer) error {
 7    ...
 8-   value, ok := s.database[shard][key]
 9+   value, ok := s.database[shard].Get(key)
10    ...
11}
12
13func (s *server) handleSetCommand(reader *messageReader, conn io.Writer) error {
14    ...
15-    s.database[shard][key] = value
16+    s.database[shard].Put(key, value)
17    ...
18}
Let’s run our benchmark again:
1❯ go test . -v -bench=BenchmarkRedisSet -benchmem -benchtime=20000000x -cpuprofile=cpu.out -run="^$"
2goos: linux
3goarch: amd64
4pkg: github.com/jauhararifin/goredis
5cpu: AMD Ryzen 9 7900X 12-Core Processor
6BenchmarkRedisSet
7BenchmarkRedisSet-24            20000000                75.42 ns/op       13258318 ops/sec           149 B/op          4 allocs/op
8PASS
9ok      github.com/jauhararifin/goredis 1.724s
Wow, that’s almost 33% improvement in throughput 🤯. Fortunately, Go 1.24 will use this technique to power Golang maps. So, we don’t have to bother implementing this ourselves.
What’s The Catch
While our implementation achieved impressive performance numbers, there are several important caveats to consider:
First, our benchmark is highly artificial. We used uniformly distributed keys which is rarely the case in real-world applications. In practice, some keys are accessed much more frequently than others, often following patterns like the Pareto principle where 20% of keys receive 80% of accesses. This access pattern can significantly impact performance, especially with our sharding strategy.
Second, the benchmarks were run on a high-end desktop processor (AMD Ryzen 9 7900X with 24 cores) with high single-thread performance and high clock speeds. Most servers use processors with different characteristics:
- Lower clock speeds to maintain reasonable power consumption and heat generation
- Higher core counts optimized for parallel workloads
- Different cache hierarchies and memory architectures
- Power and thermal constraints that can affect sustained performance
Third, our architecture differs significantly from Redis in important ways:
- Redis is primarily single-threaded, which simplifies implementation of features like transactions and atomic operations
- Our multi-threaded approach adds complexity for handling concurrent access
- We haven’t implemented key features like expiration which would add overhead and complexity
- Adding expiration would require additional data structures and background processing to track and remove expired keys
- Our implementation lacks many Redis features like persistence, replication, and the full command set
The key takeaway is that raw performance numbers in isolation don’t tell the whole story. Real-world performance depends heavily on actual usage patterns, hardware characteristics, and required feature set.
Where To Go From Here
If you’re interested in diving deeper into the topics covered, here are some excellent topics you can learn:
- A Guide to the Go Garbage Collector.
- What Every Programmer Should Know About Memory.
- Lock Free Data Structure
- Systems Performance book by Brendan Gregg
- Designing SIMD Algorithm From Scratch.